
Network intelligence built for action
GoodShip continuously analyzes your freight network to surface the cost and service opportunities that matter most, show you what’s driving them, and recommend what to do next.
Request a Demo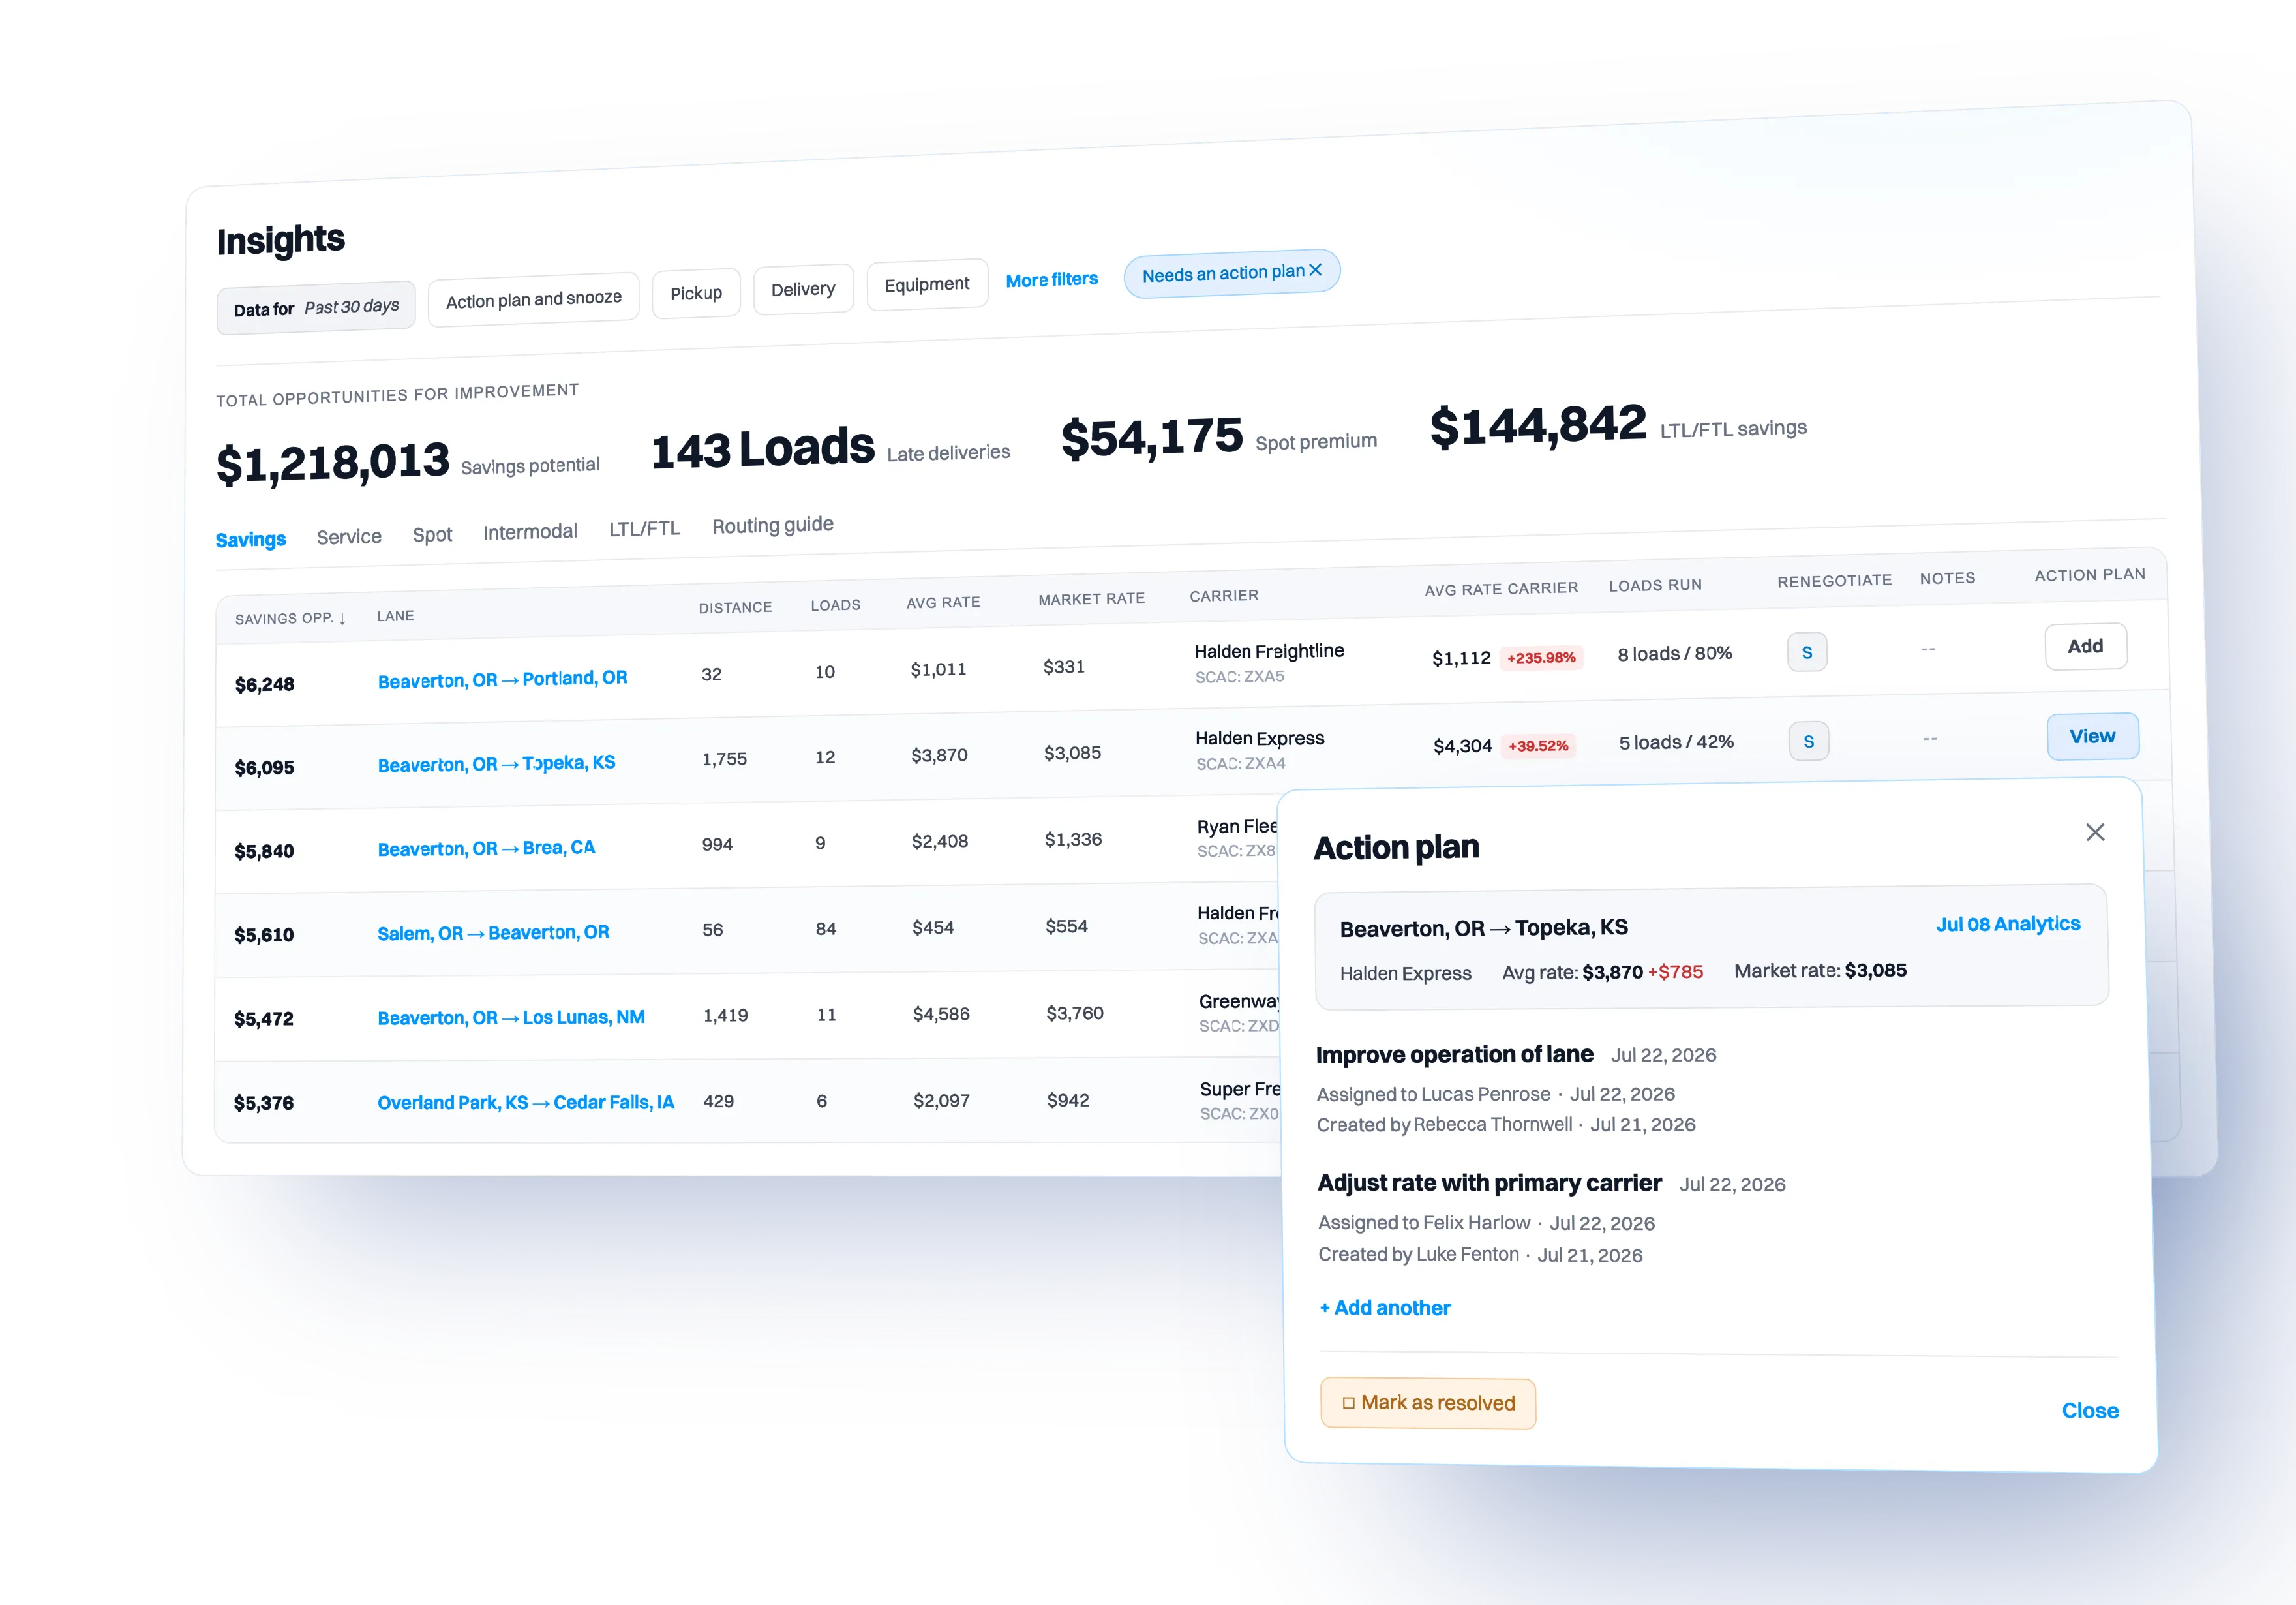
Sound familiar?
The network you’re running isn’t the one you planned
Volumes shift, rates move, carriers reject tenders, and freight moves to higher-cost backups and spot. Over time, your network drifts further from the plan you awarded.
No single system has the full picture
Loads and tenders in the TMS, benchmarks in your market feed, targets in a finance file, accessorials buried in invoices. Every system holds part of the story, leaving teams to piece together the full picture.
Problems persist longer than they should
Teams arrive at the meeting working from different numbers and spend it debating whose version is right. In the meantime, overspend and service issues continue to add up.
Freight network intelligence, all in one place
Network and lane analytics
Monitor performance across your network, then drill into the lanes driving the results.
- —Track transportation spend across lanes, carriers, and modes
- —Compare cost by carrier, mode, and time period
- —Understand the lane-level factors driving changes

Rate and budget benchmarking
Compare rates against the market, internal budgets, historical performance, and custom targets.
- —Benchmark contract and spot rates against DAT, Truckstop, and FreightWaves SONAR
- —Compare actual spend against internal budgets and targets
- —Separate linehaul, fuel, and accessorials for more accurate comparisons
- —Apply mode-specific fuel schedules across truckload, LTL, and intermodal

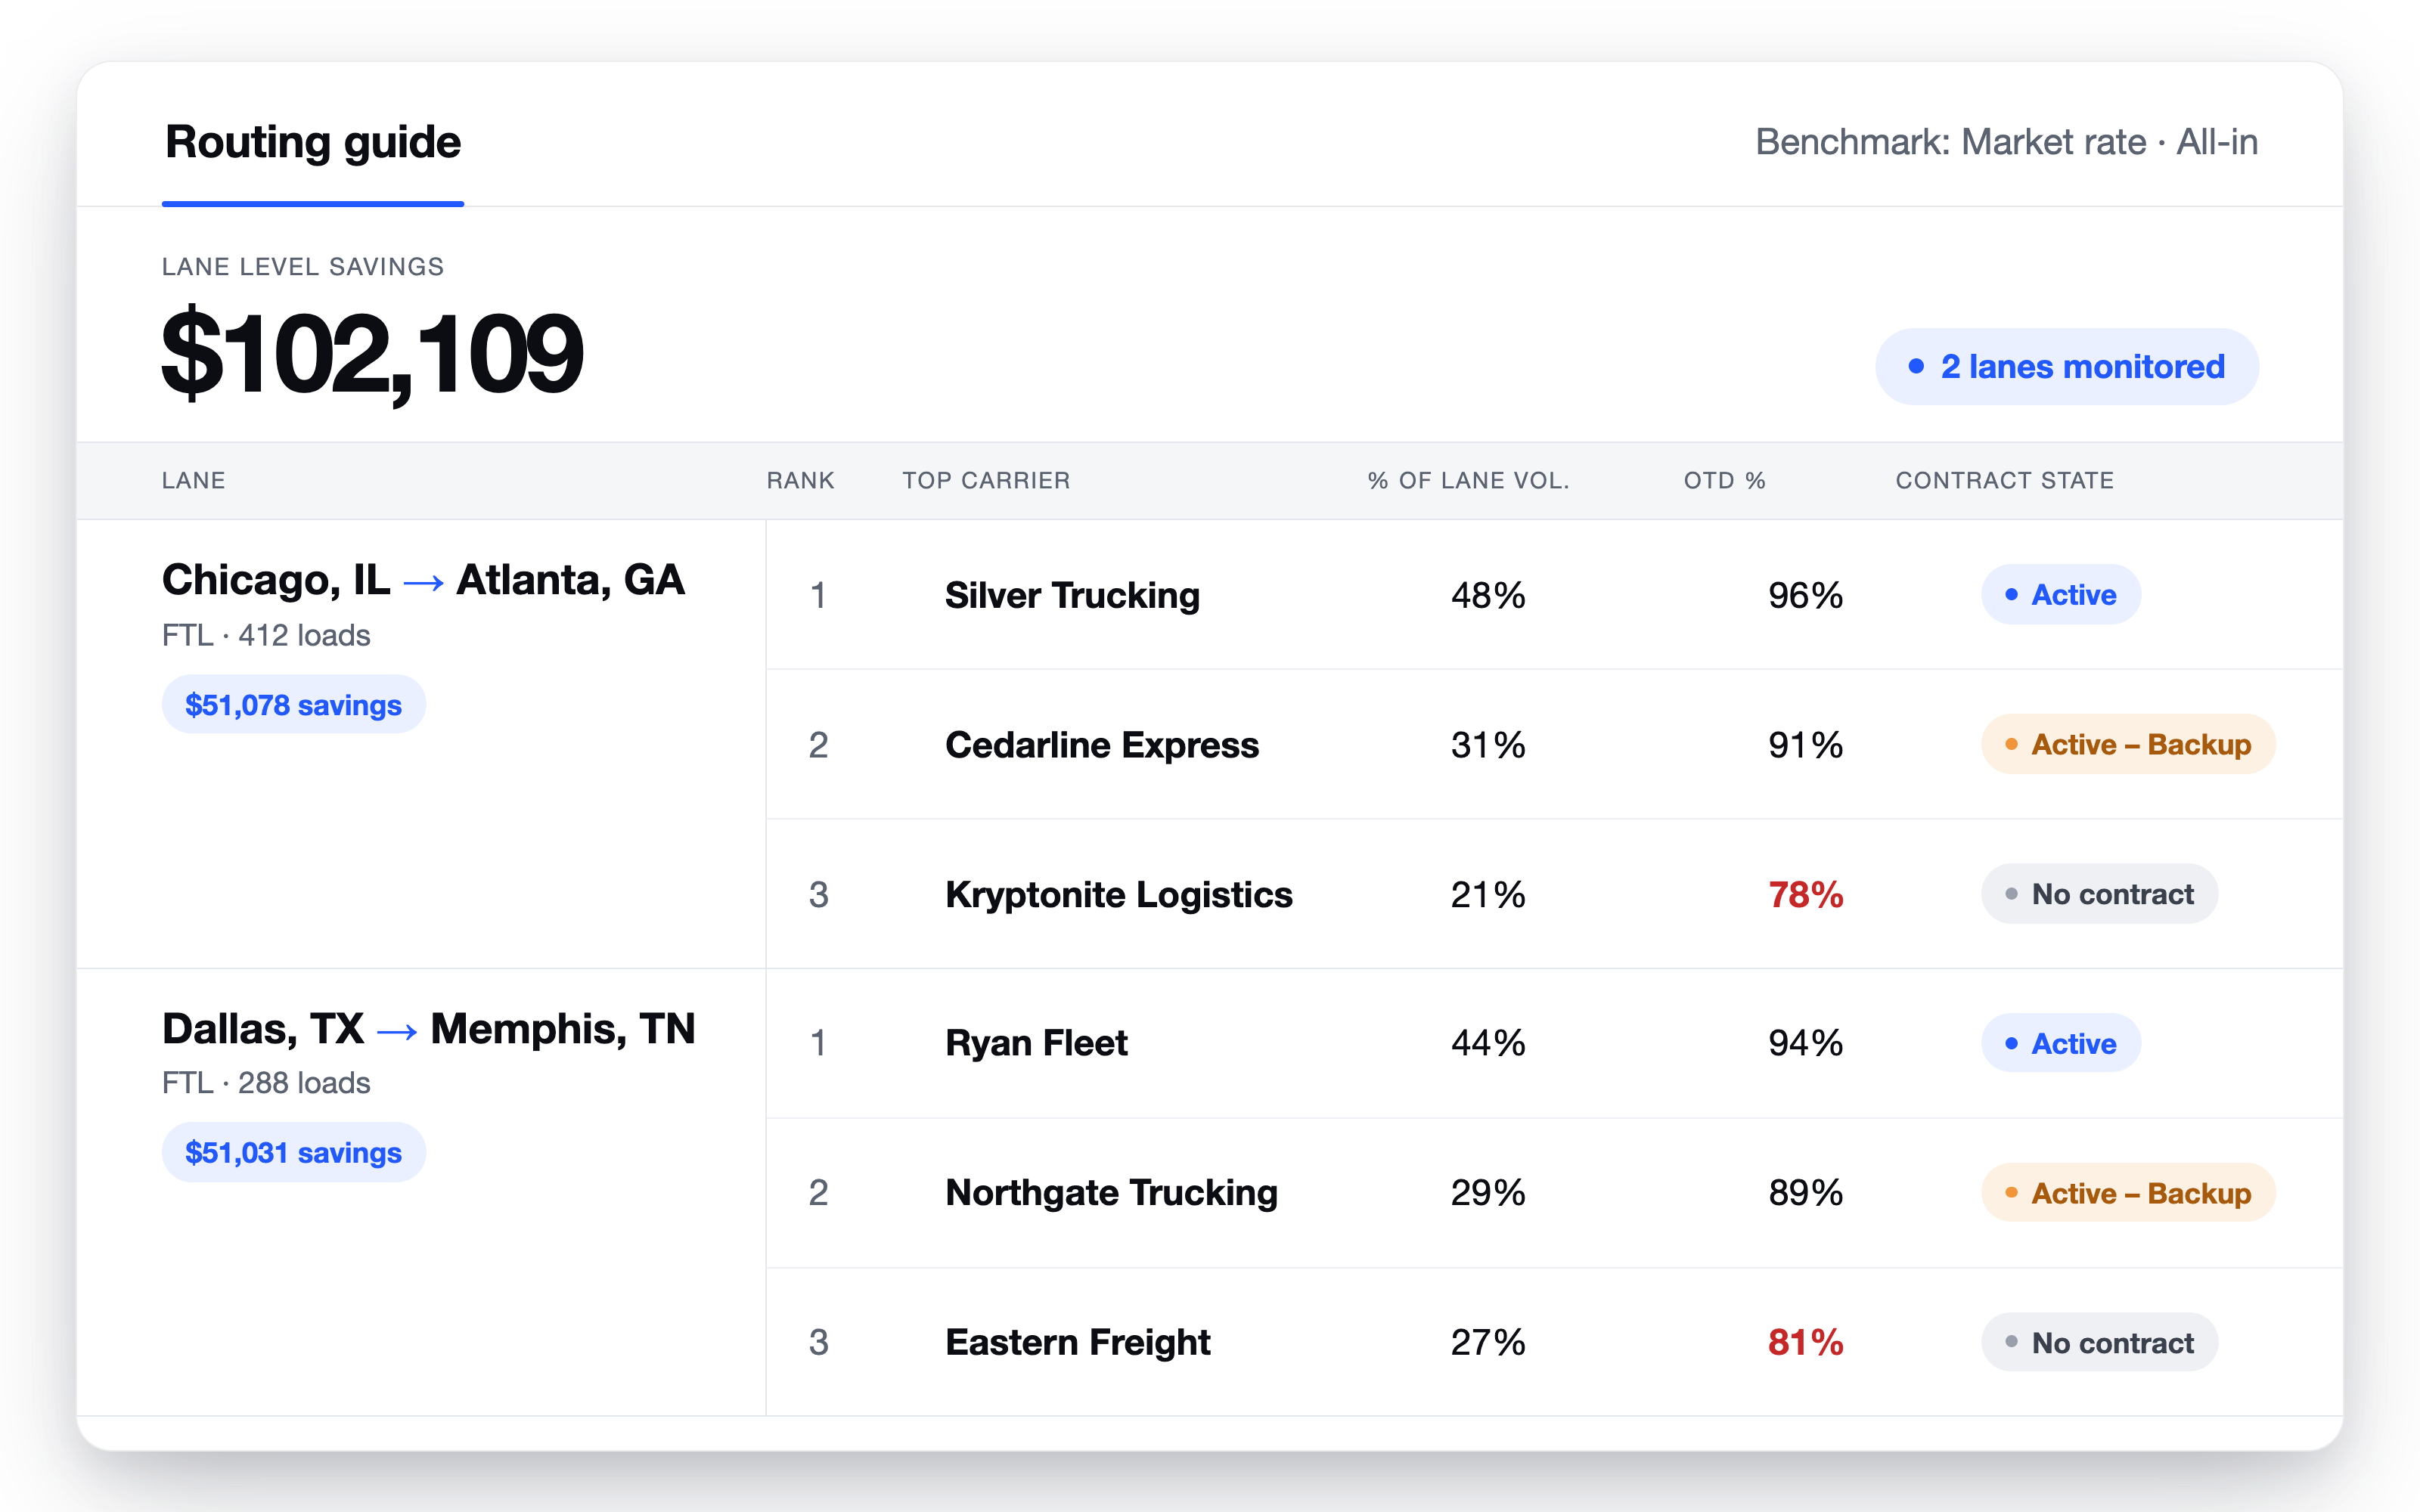
Routing guide and contract monitoring
See where your routing guide is breaking down and what’s driving it.
- —Identify routing guide leakage, commitment gaps, and unnecessary spot exposure
- —Compare actual tender activity against awarded rates and commitments
- —See who was offered each load, who accepted it, and what it cost
- —Pinpoint tendering behavior that increases cost or service risk
Targeted insights and recommendations
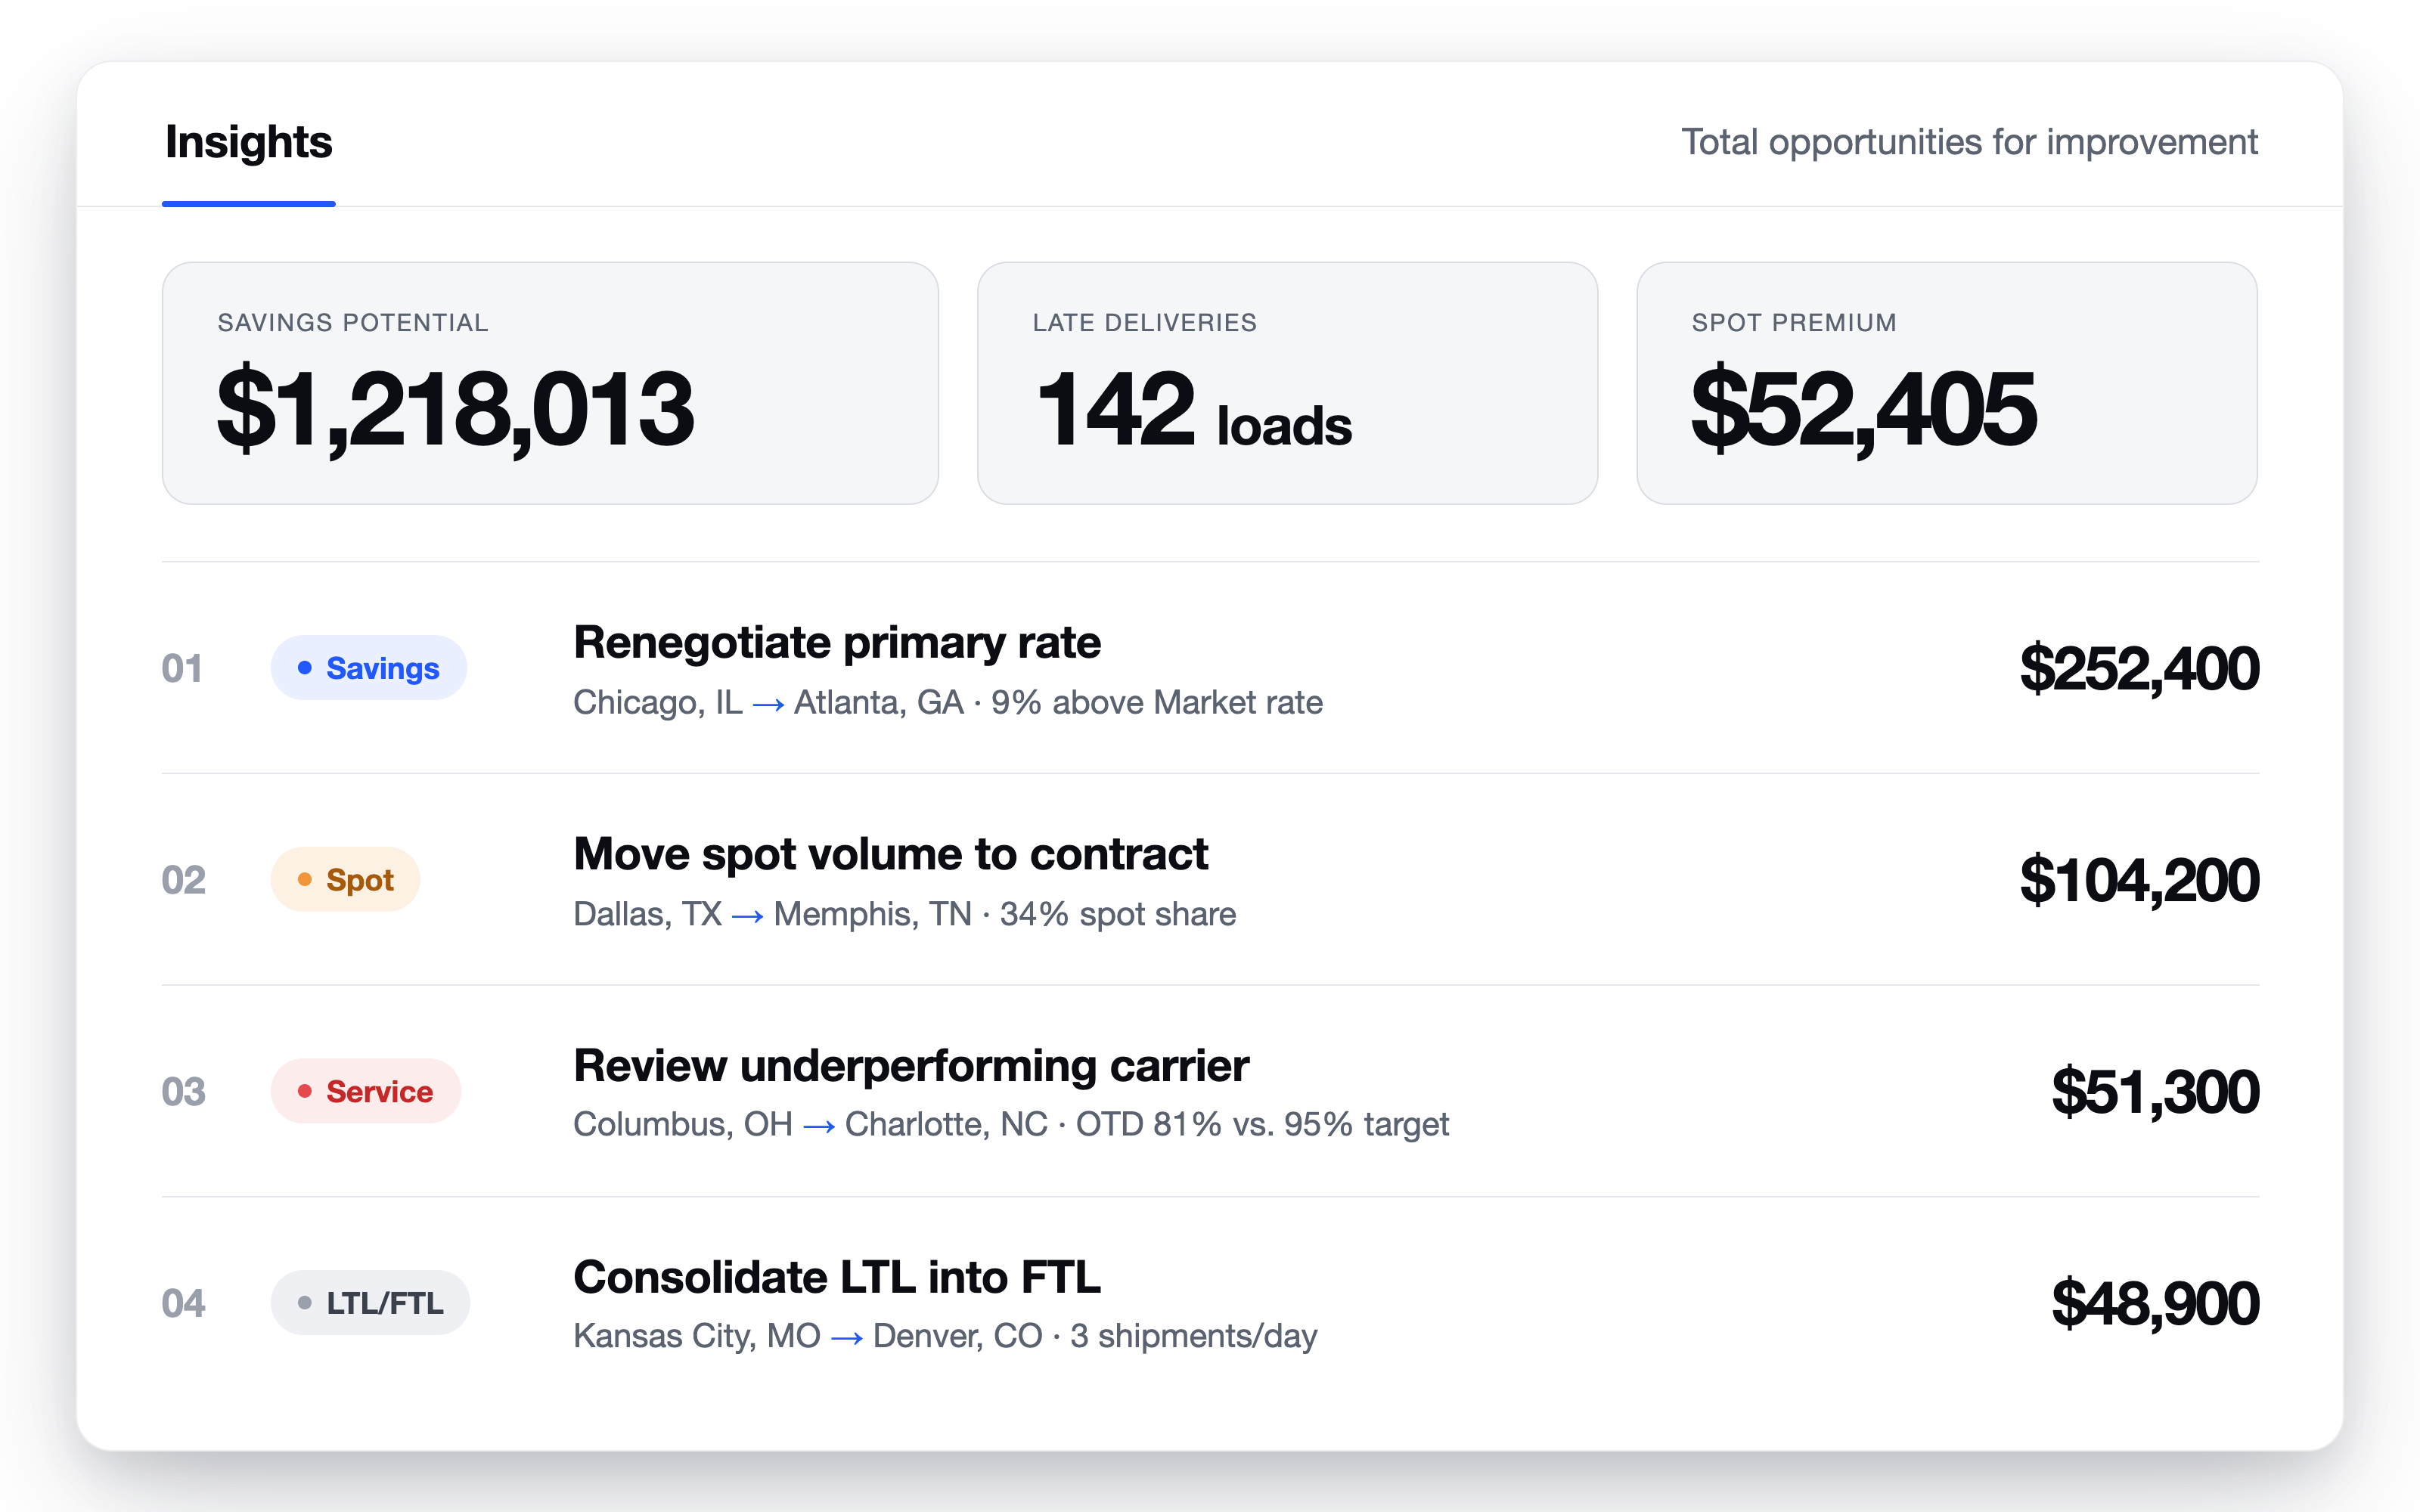
GoodShip continuously scans your network to surface and prioritize the cost and service opportunities that matter most.
- —Identifies lanes running above market or budget
- —Flags service issues and recurring spot exposure
- —Prioritizes opportunities based on potential dollar impact
- —Recommends next steps, from renegotiation and mini-bids to routing guide corrections
Action plans and ROI tracking
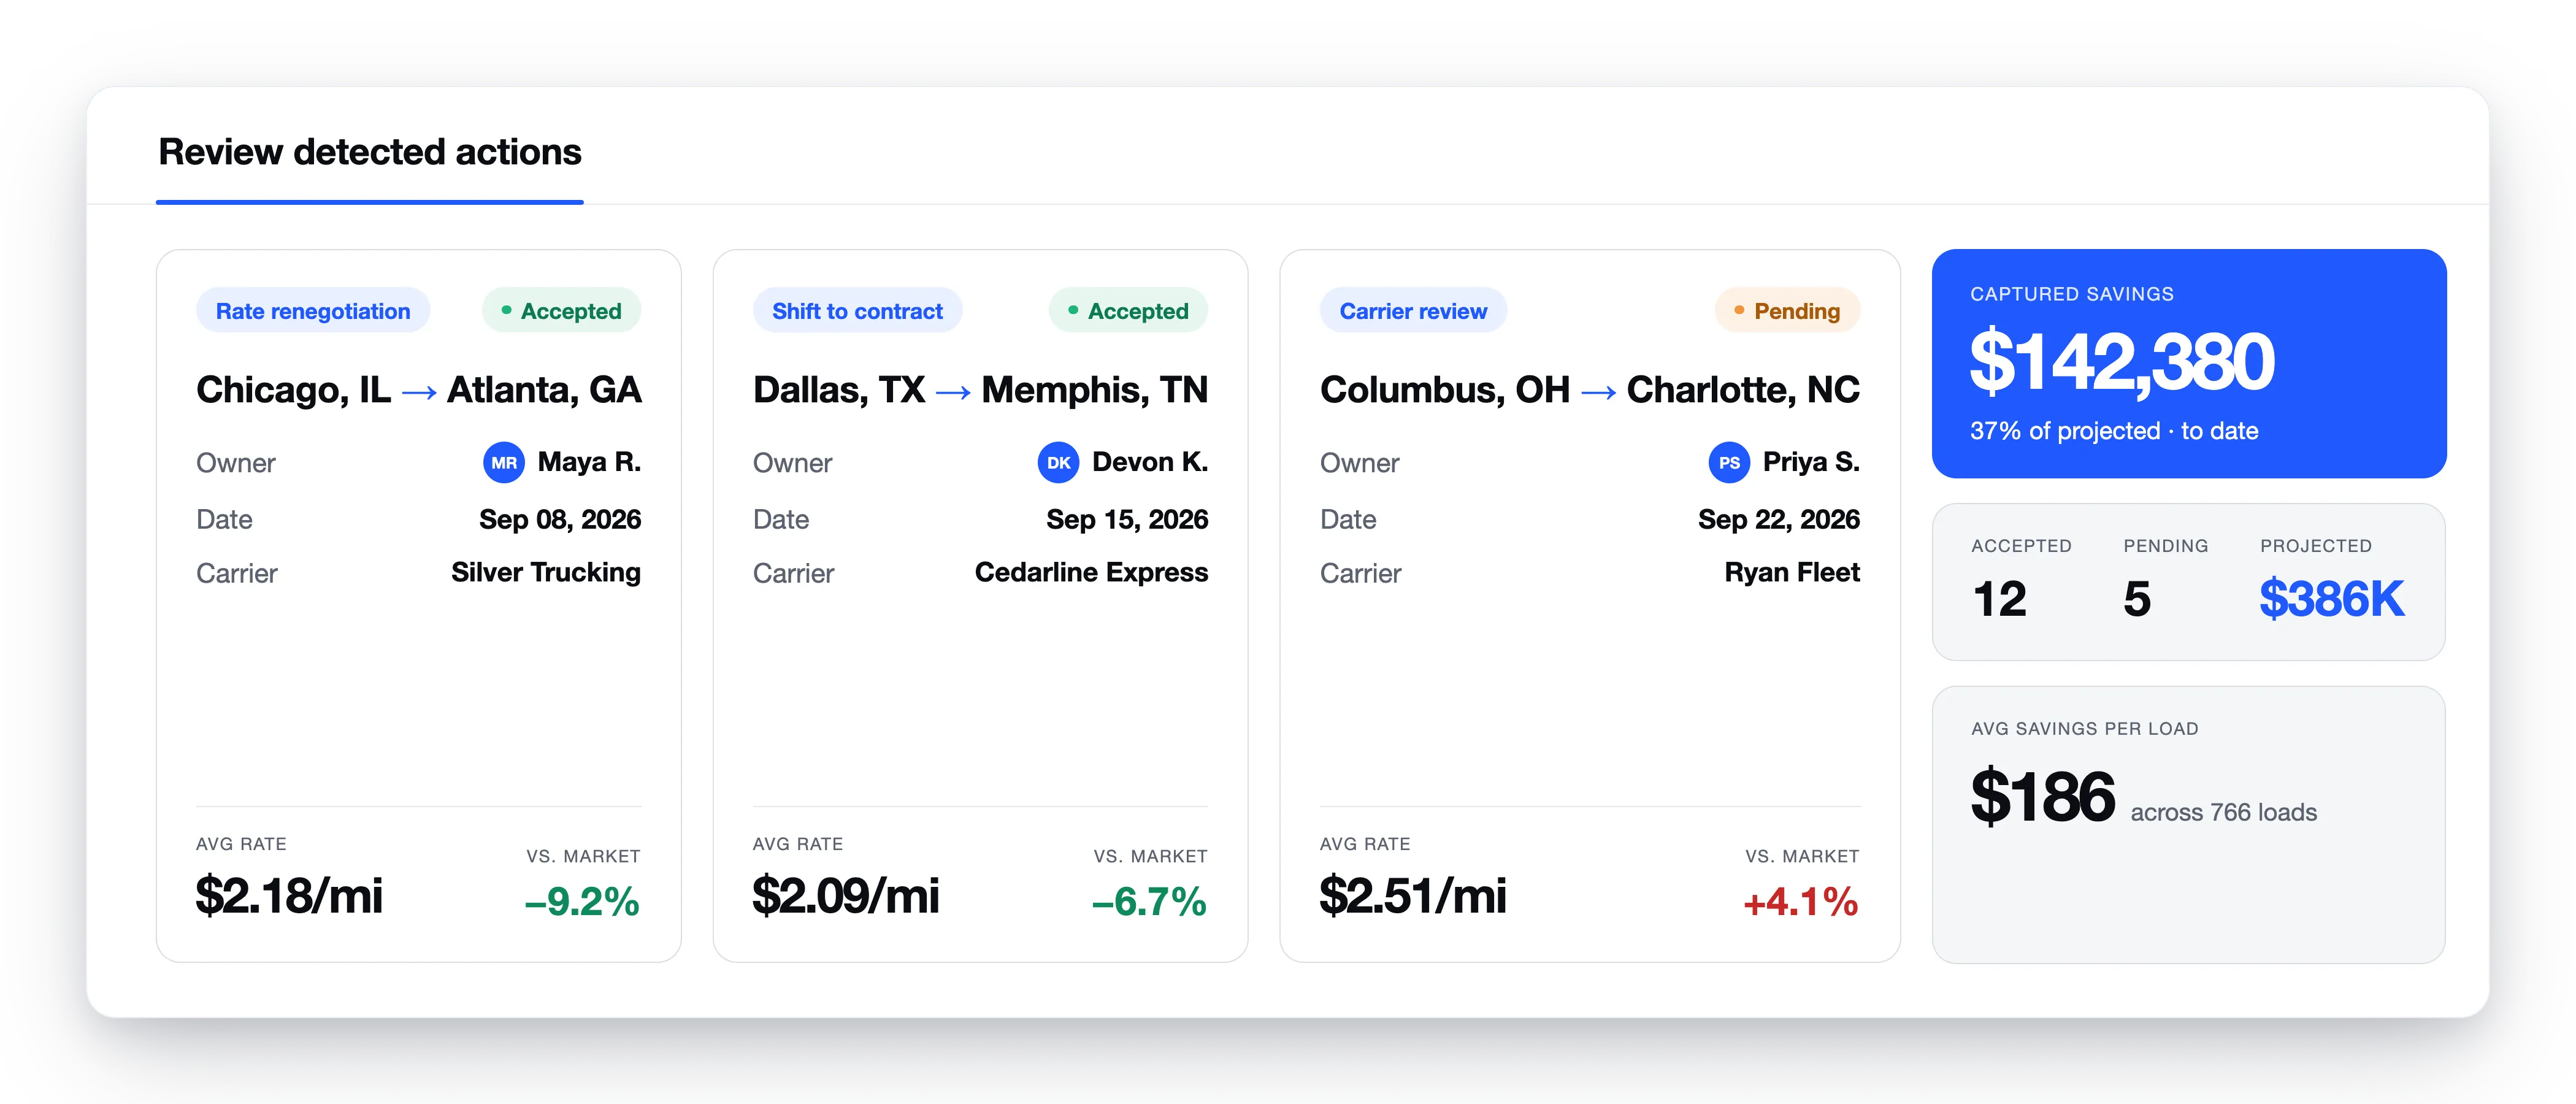
Turn recommendations into action and measure the results.
Request a Demo- —Assign owners and due dates to recommended actions
- —Collaborate with teammates and track progress in one place
- —Connect actions to the relevant lanes and carriers
- —Measure the savings or performance improvement from each action
$105M in opportunities identified for one GoodShip customer
Across three months, GoodShip analyzed roughly 200,000 loads in a $1B transportation network against market rates and identified $105M in savings opportunities. Here are a few examples of what GoodShip surfaced:
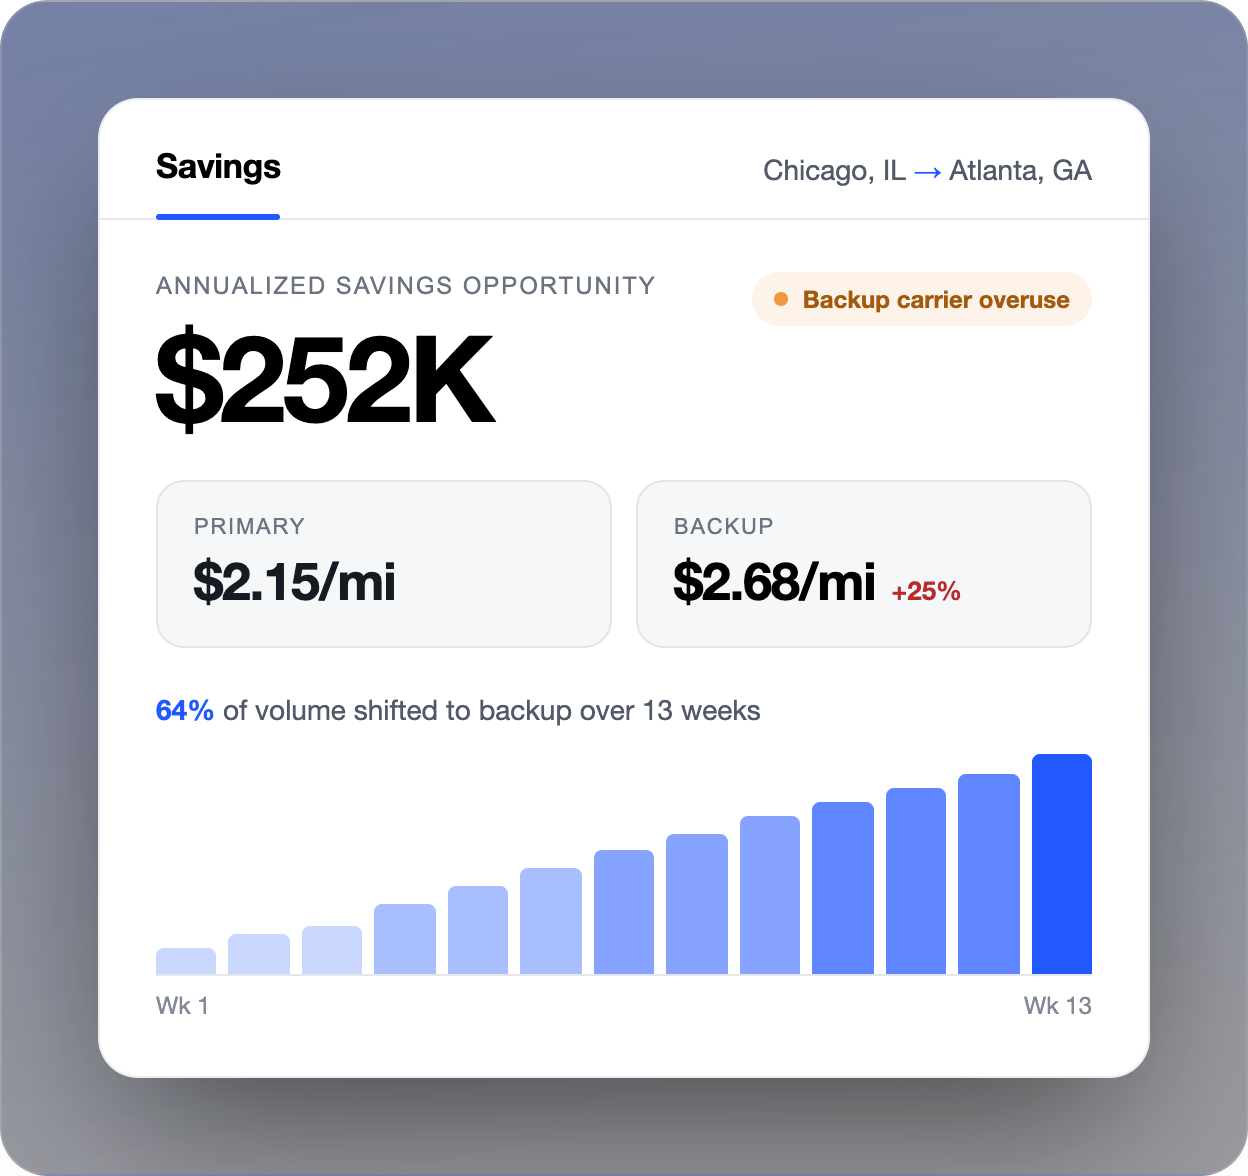
$252K opportunity
Freight was consistently skipping the awarded primary and moving with a more expensive backup.
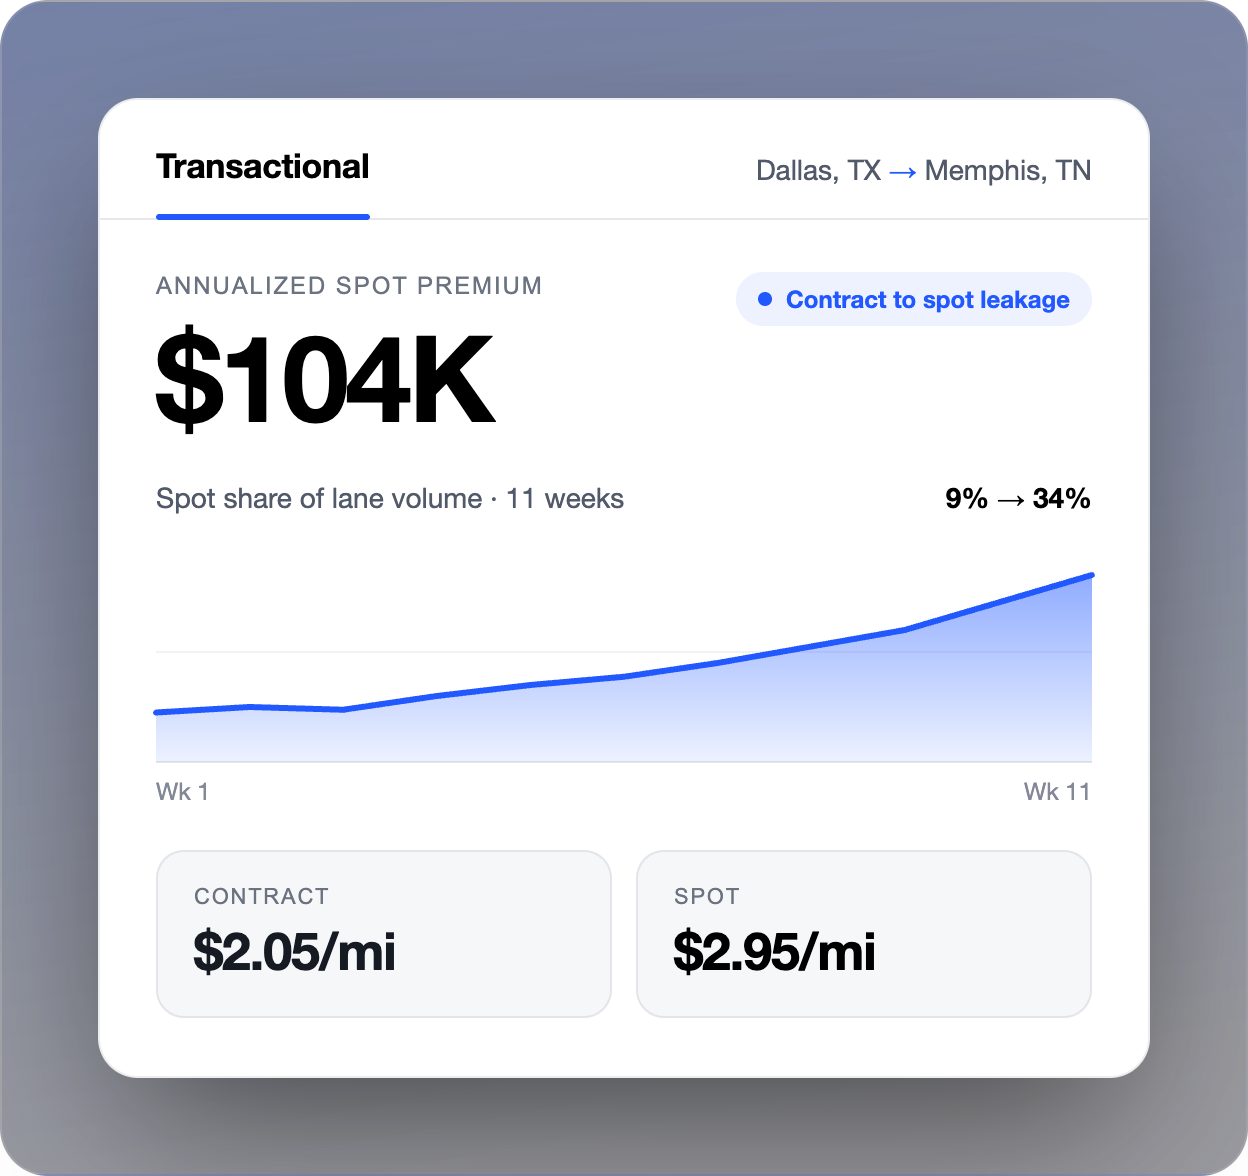
$104K opportunity
A contracted lane had moved 100% spot for 11 straight weeks, creating a significant rate gap.
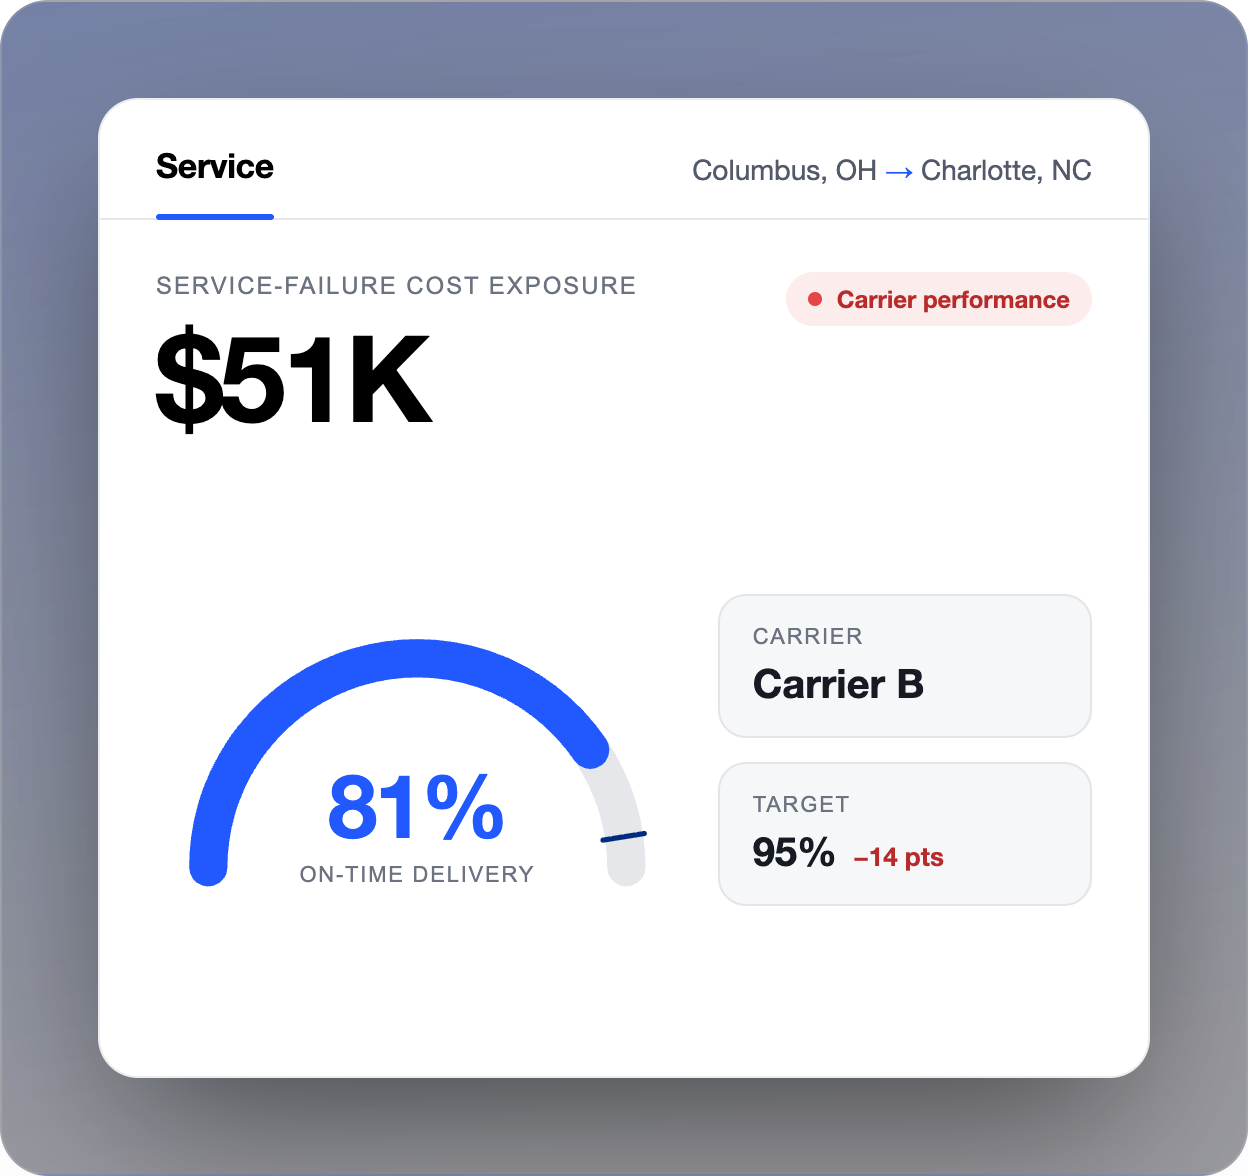
$51K opportunity
GoodShip identified declining on-time performance and quantified the impact.
Just ask Laney
Laney, GoodShip’s AI Transportation Analyst, analyzes your transportation data to answer questions, uncover what’s driving performance, and recommend what to do next. Ask in plain language and get answers grounded in your network.
Meet Laney
Find the opportunities hiding in your freight network
See how GoodShip helps your team identify where cost and service are off track, understand what’s driving it, and take action.
Request a DemoYou’ve got questions, we’ve got answers
What KPIs and metrics can I track in GoodShip?
Whichever ones your business runs on. GoodShip can start with the standard transportation metrics — cost per load and per mile, spend to budget, discount to market, tender acceptance, on-time pickup and delivery, spot exposure, etc. — and we’ll recommend a starting set based on what we see working for similar networks. But we’ve built hundreds of unique KPIs and metrics for shippers who measure their business their own way, and that’s the more common path. If the data exists, we can map it and build the metric with your definitions and thresholds.
Is GoodShip a TMS?
No, but GoodShip does plug into your TMS. Think of GoodShip as an extension of your existing systems, supercharging your ability to analyze performance and take quick corrective action.
How is GoodShip different from a TMS or a BI tool?
A TMS records what happened, a BI tool visualizes it, and GoodShip tells you which parts of it are costing you money and gives you the workflow to fix them. Most GoodShip customers were heavy BI users before us, and still are — the tools coexist.
| Capability | TMS | BI tool | GoodShip |
|---|---|---|---|
| Records transactions | Yes | No | No |
| Visualizes your data | Limited | Yes | Yes |
| Market benchmarks built in | No | Only if you buy and maintain the feed | Yes |
| Normalizes accessorials, fuel, and all-in spot | No | Only if you build the logic | Yes |
| Ranks opportunities by dollar impact | No | No | Yes |
| Executes the fix (RFP, mini-bid, scorecard) | Partial | No | Yes |
| Maintained by | Your vendor | Your analysts | GoodShip |
Can we prove the ROI of the actions we take in GoodShip?
Yes, that’s what action plans and ROI tracking are for. Every recommendation can become an action plan with an owner and a due date, and GoodShip measures what that action produced: savings realized, service improvement, change in spot exposure. Nothing gets identified and then quietly dropped — you can see what’s in flight, what’s closed, and what each one actually returned.
Our data isn’t perfectly clean. Are we too early for this?
Probably not. The messiness is usually in accessorial coding and lane definitions, and normalizing that is part of onboarding, not a prerequisite for it. All GoodShip needs to start is your TMS data.


