The AI engine optimizing
modern freight networks

Unify your transportation data, pinpoint opportunities and risks, and take action to continuously optimize network performance.

Request a Demo

Trusted by

See what's on board

‹
›
For Shippers

Continuously optimize your freight network

  • Reduce transportation costs
  • Run smarter, faster procurement events
  • Improve service and on-time delivery
  • Identify risks and opportunities with AI
  • Strengthen carrier relationships
Learn more
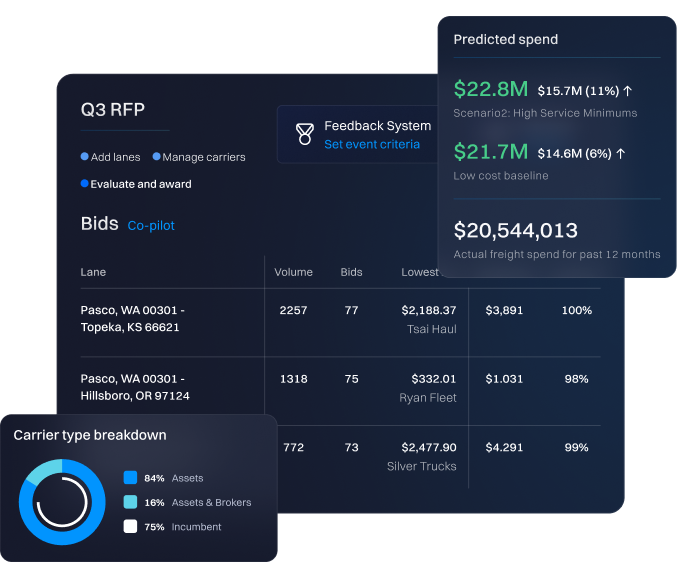
Dark-themed software interface labeled Q3 RFP showing bid management with lanes, carriers, and evaluation steps. A table lists lanes between cities with volume, bids, lowest bid amounts, and carriers. Predicted spend section highlights $22.8M and $21.7M with percentage increases, and actual freight spend of $20,544,013 for past 12 months. Carrier type breakdown shows a pie chart with 84% assets, 16% assets & brokers, and 75% incumbent.
‹
›
For Brokers

Run a more intelligent, profitable brokerage

  • Grow revenue without adding overhead
  • Price and respond to RFPs faster
  • Win the right freight at the right margin
  • Strengthen customer relationships
  • Identify risks and opportunities with Al
Learn more
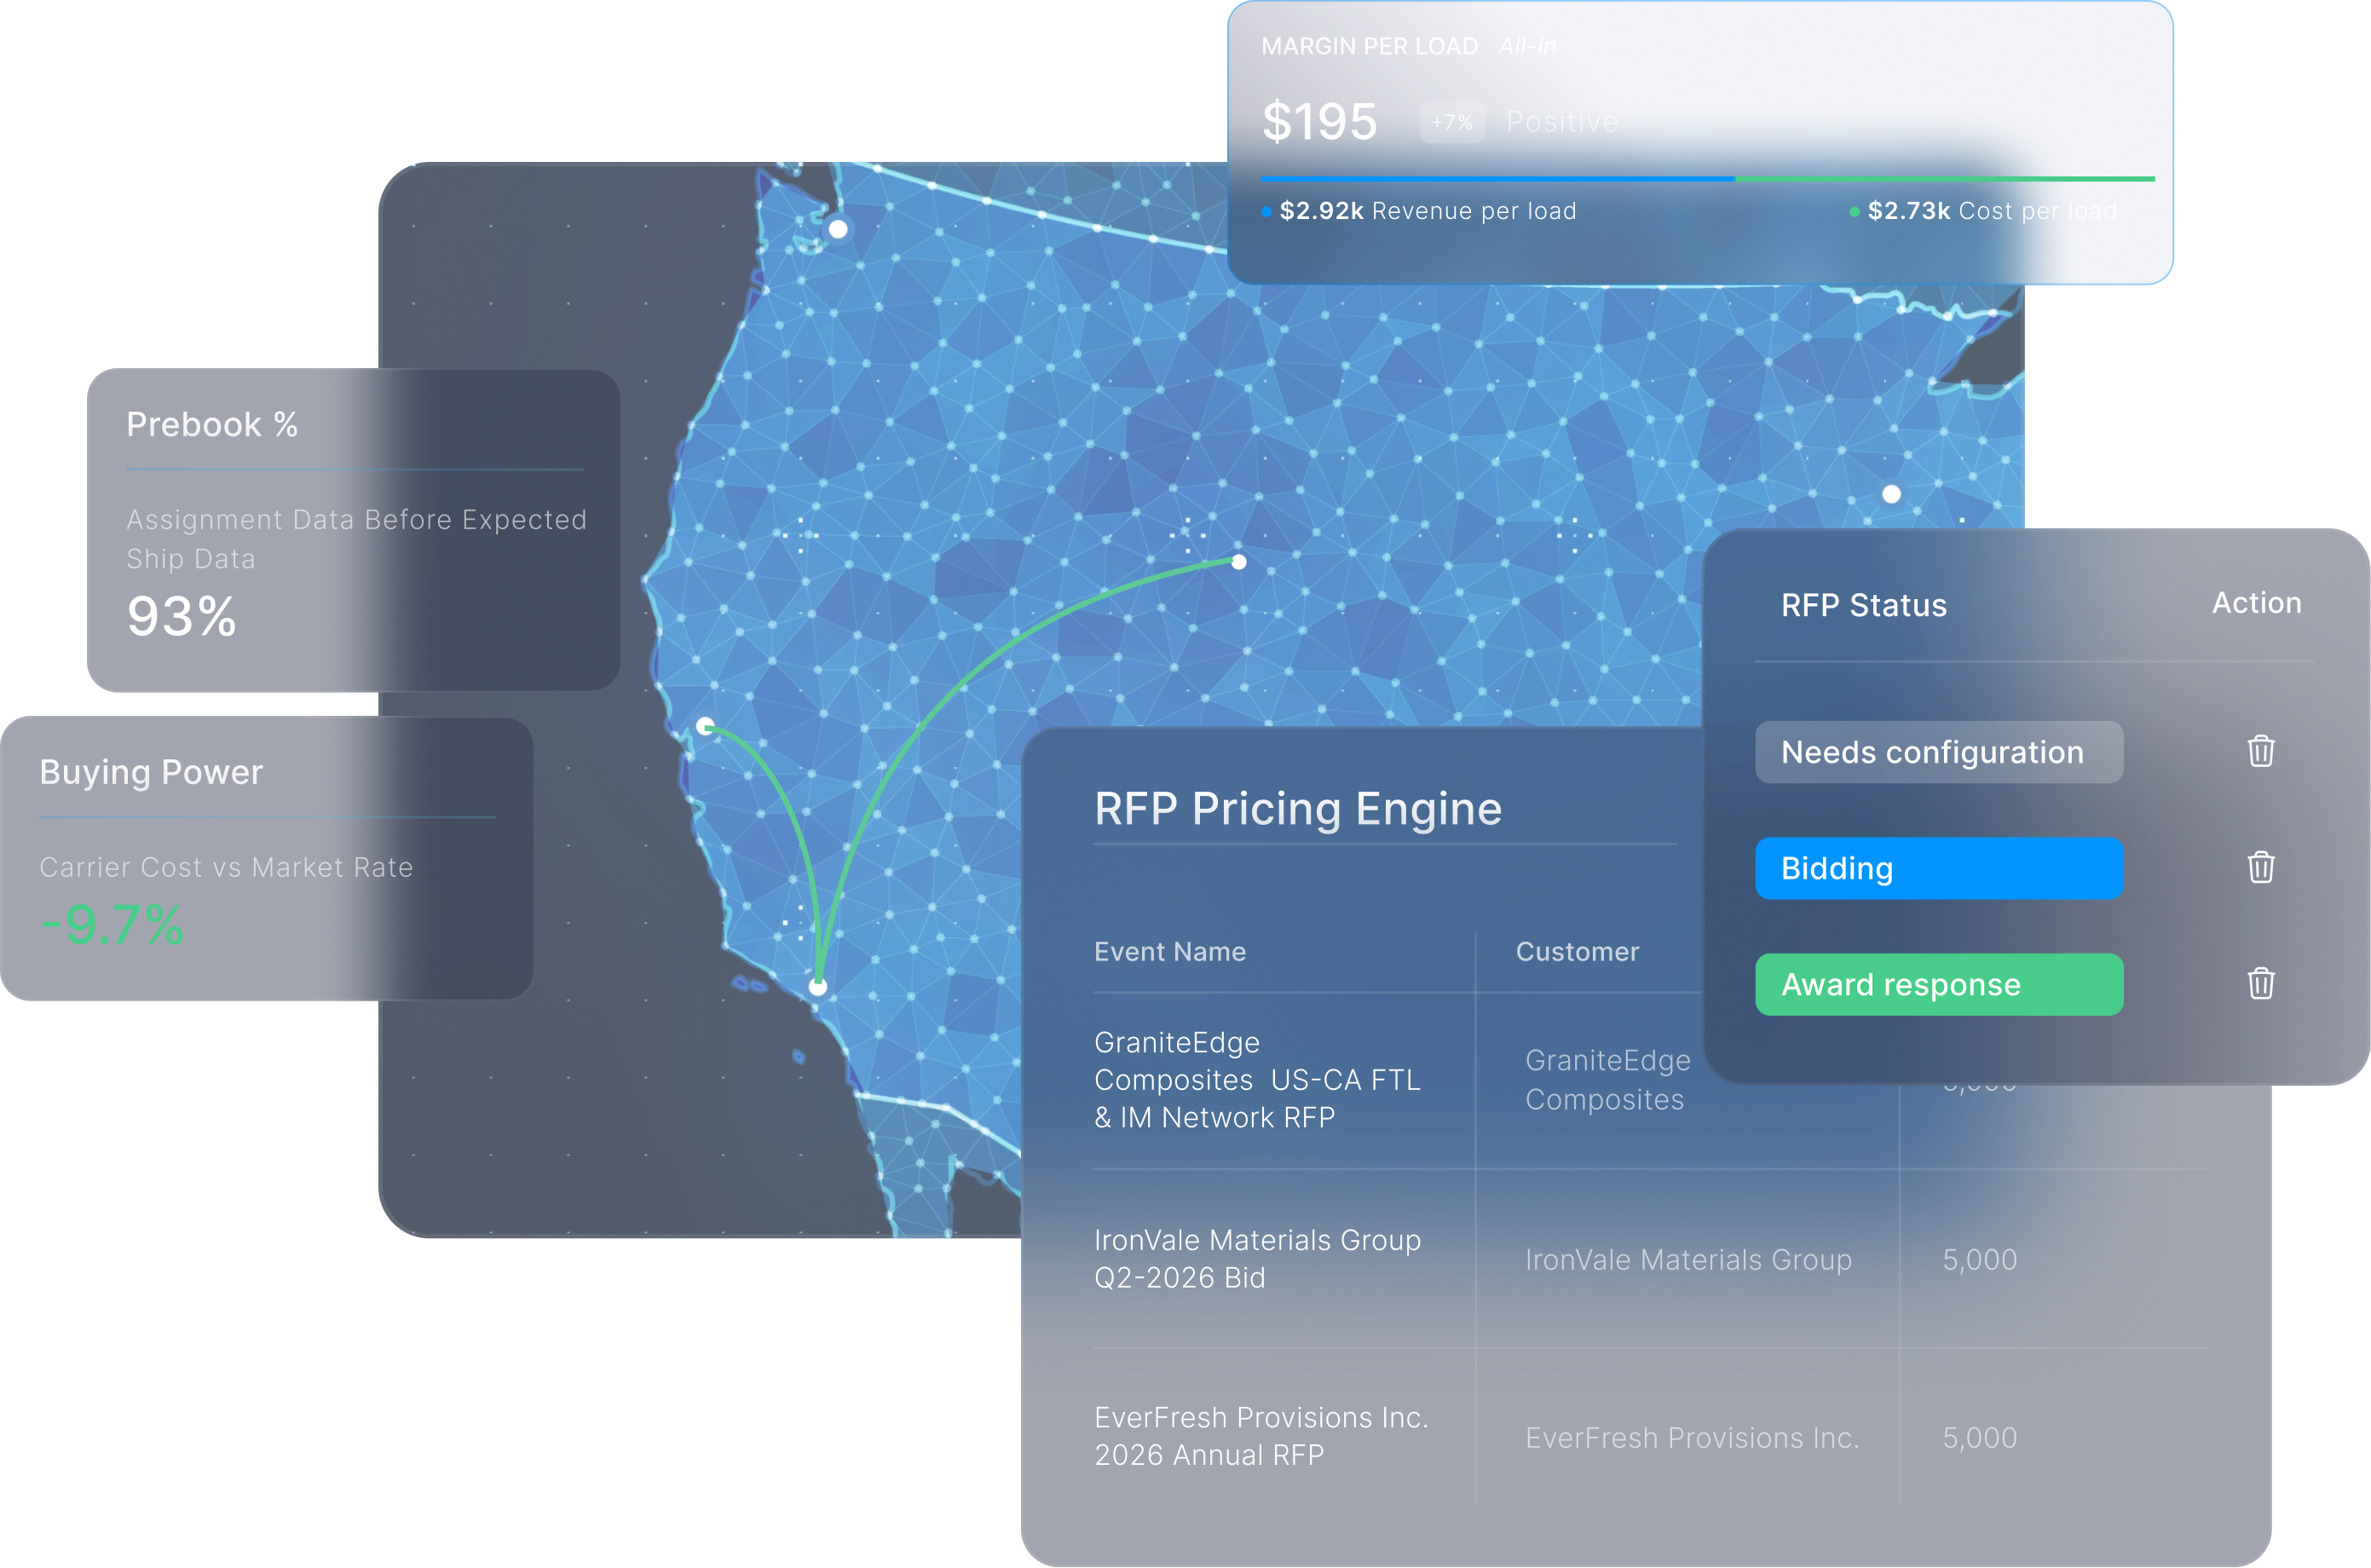
Digital dashboard showing a US West Coast map with network connections, and data panels for logistics metrics including 93% prebook percentage, -9.7% carrier cost vs market rate buying power, margin per load of $195 positive, and an RFP pricing engine table listing event names, customers, and values with RFP status options: needs configuration, bidding, award response.
‹
›
FOR ASSET-BASED CARRIERS

Run a more intelligent, profitable network

  • Price and respond to RFPs faster
  • Win freight that fits your network
  • Improve utilization across your network
  • Be a better partner to every shipper
  • Identify risks and opportunities with Al
Learn more
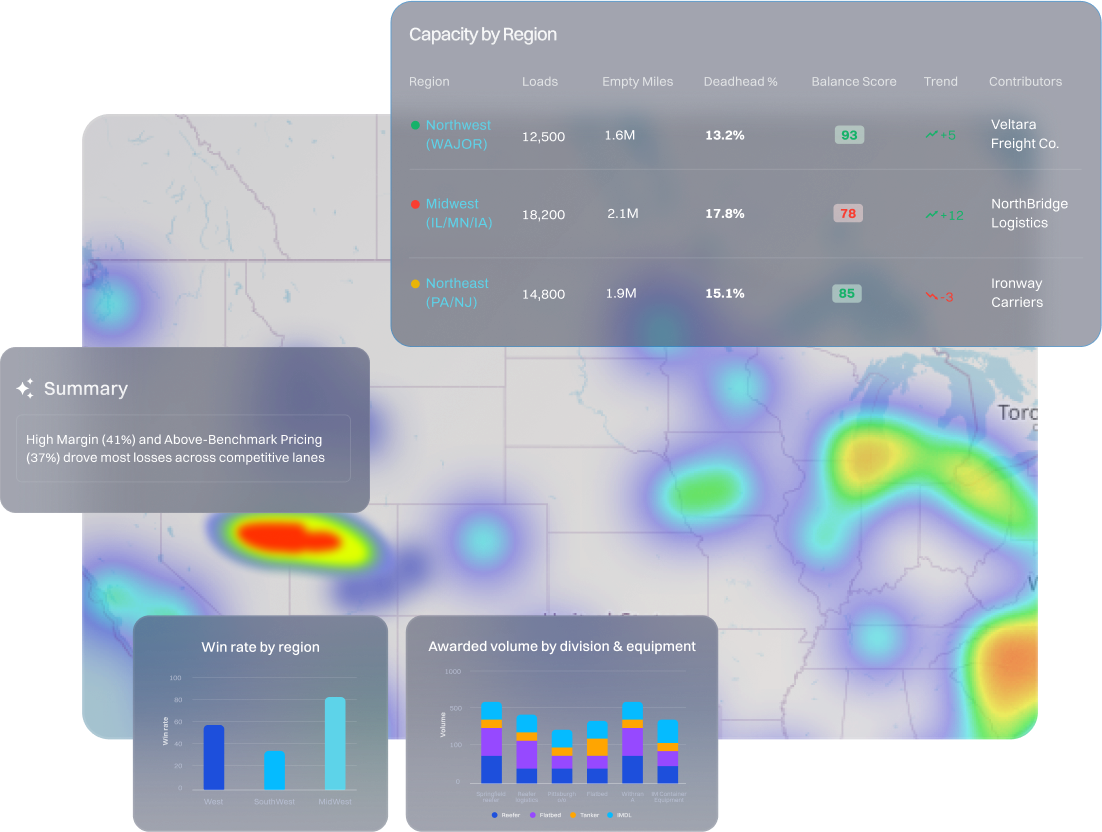
A heatmap over a U.S. map showing freight capacity and logistics data including region-specific metrics and charts. The Capacity by Region table lists Northwest, Midwest, and Northeast with loads, empty miles, deadhead percentages, balance scores, trends, and contributors. The Summary highlights high margin and above-benchmark pricing driving losses in competitive lanes. Two charts display win rate by region and awarded volume by division and equipment type with colored bars. Heatmap colors range from blue to red indicating intensity in freight activity across regions.

Know where to take action

GoodShip unifies your transportation data, helping you pinpoint opportunities and risks, understand what’s driving them, and take action with confidence.

Meet Laney, your AI transportation analyst

Ask Laney anything about your network and get a grounded, data-backed answer in seconds — not a generic AI response.

Lane Deep Dives

Get instant seasonality, rate, and capacity context for any lane, without pulling a report.
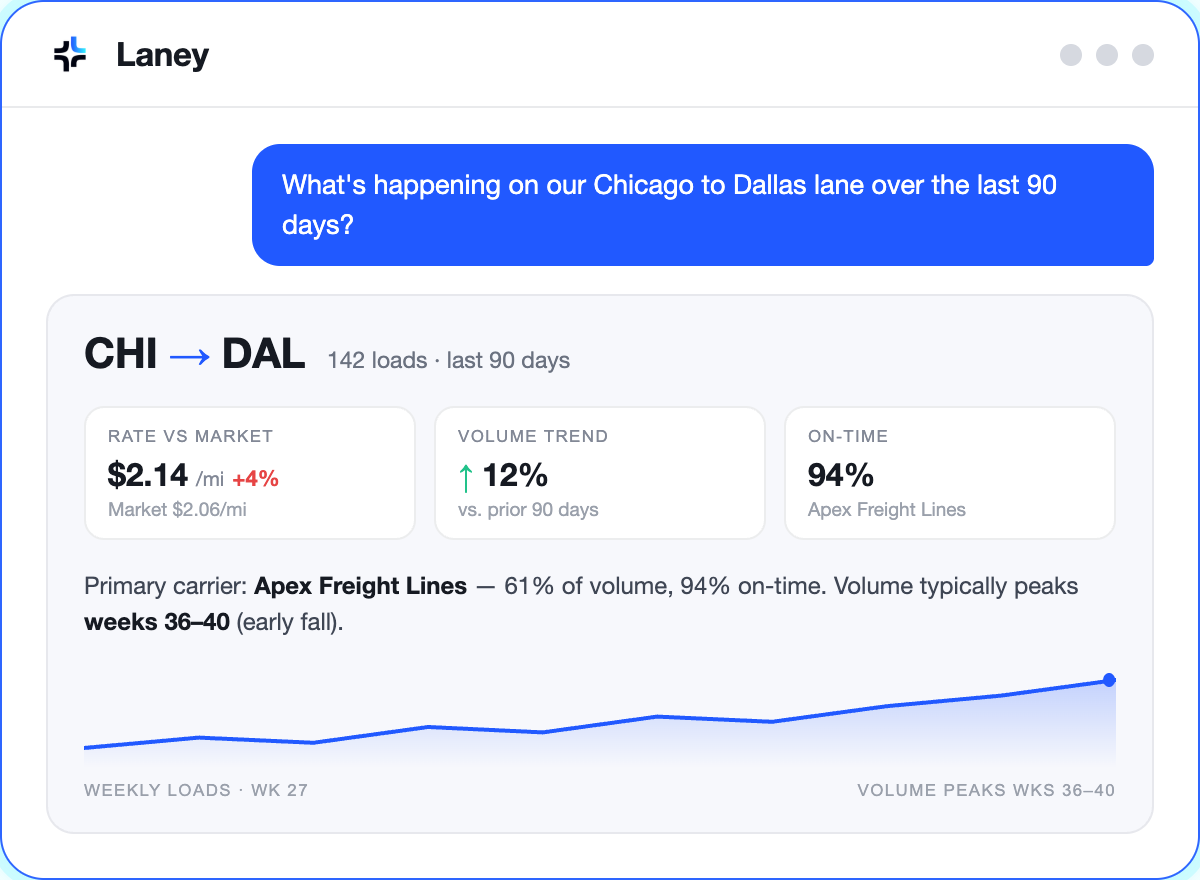
Dashboard showing Chicago to Dallas lane performance over the last 90 days with 142 loads. Rate is $2.14 per mile, 4% above $2.06 market rate. Volume increased 12% compared to prior 90 days. On-time rate is 94% by Apex Freight Lines. Apex Freight Lines is primary carrier with 61% volume and 94% on-time performance. Volume peaks weeks 36 to 40. Line graph shows weekly loads trend rising from week 27 to volume peaks at weeks 36 to 40.

Carrier Performance

Compare any carrier's tender acceptance, on-time performance, or dispute history.
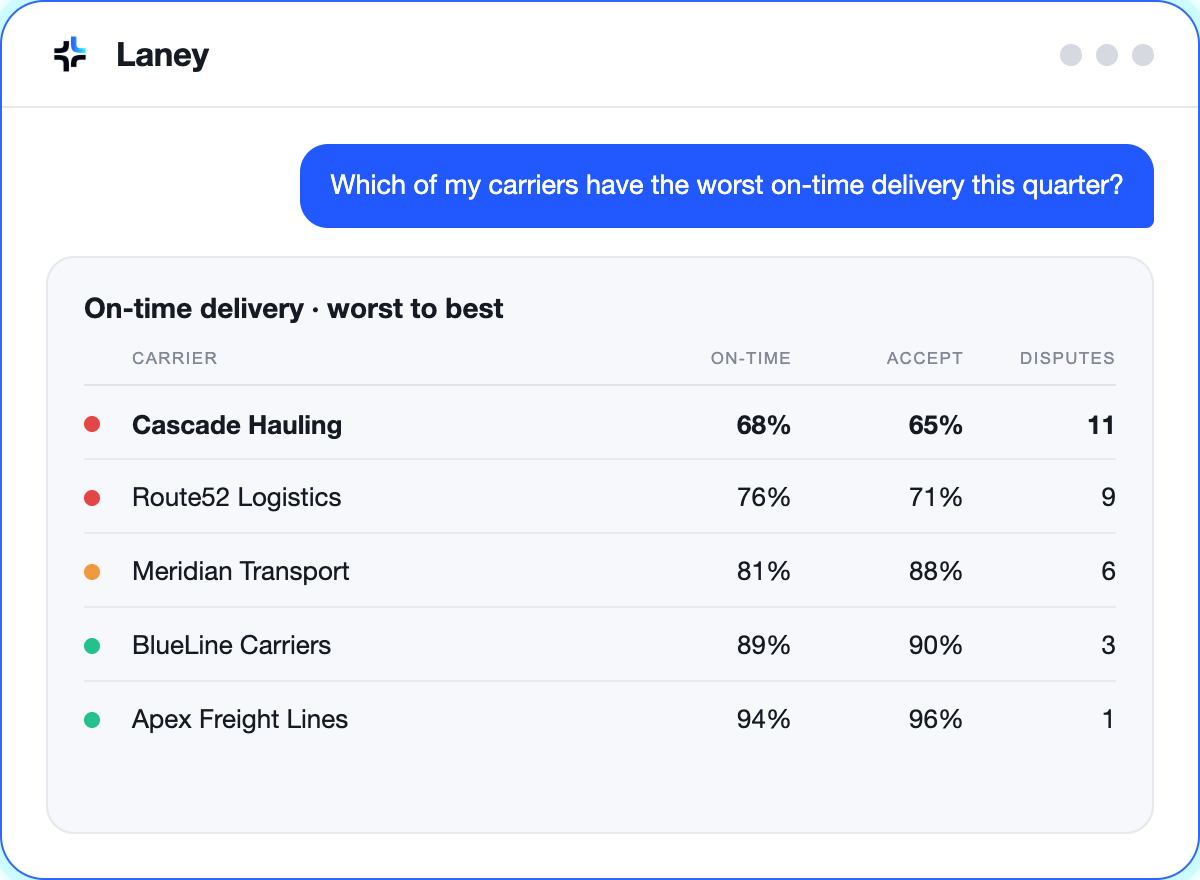
Screen showing a Laney interface with a question about the worst on-time delivery carriers this quarter, followed by a table ranking five carriers from worst to best on on-time delivery, acceptance rate, and disputes: Cascade Hauling 68%, 65%, 11 disputes; Route52 Logistics 76%, 71%, 9 disputes; Meridian Transport 81%, 88%, 6 disputes; BlueLine Carriers 89%, 90%, 3 disputes; Apex Freight Lines 94%, 96%, 1 dispute.

Rate Benchmarking

See instantly which lanes are priced above or below market, and by how much.
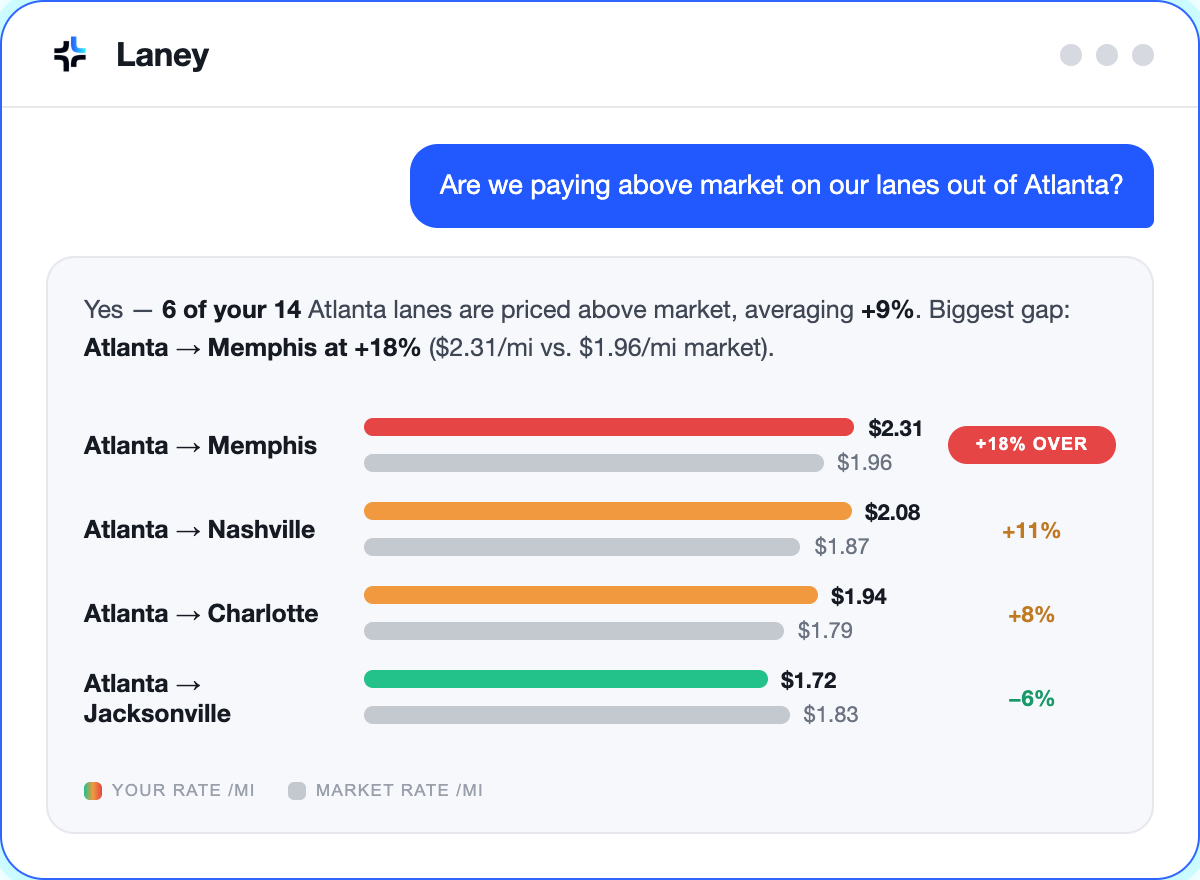
Chat interface from Laney showing response to a question about lane payment rates from Atlanta. It states 6 of 14 lanes are priced above market with an average +9%. The biggest gap is Atlanta to Memphis at +18%, $2.31 per mile versus $1.96 market rate. A bar chart compares rates for four routes: Atlanta to Memphis ($2.31, +18% over market), Atlanta to Nashville ($2.08, +11%), Atlanta to Charlotte ($1.94, +8%), and Atlanta to Jacksonville ($1.72, -6%). Colored bars represent user rates and grey bars represent market rates.

Overspend Alerts

Spot the lanes running hottest over budget or market before they become a bigger problem.
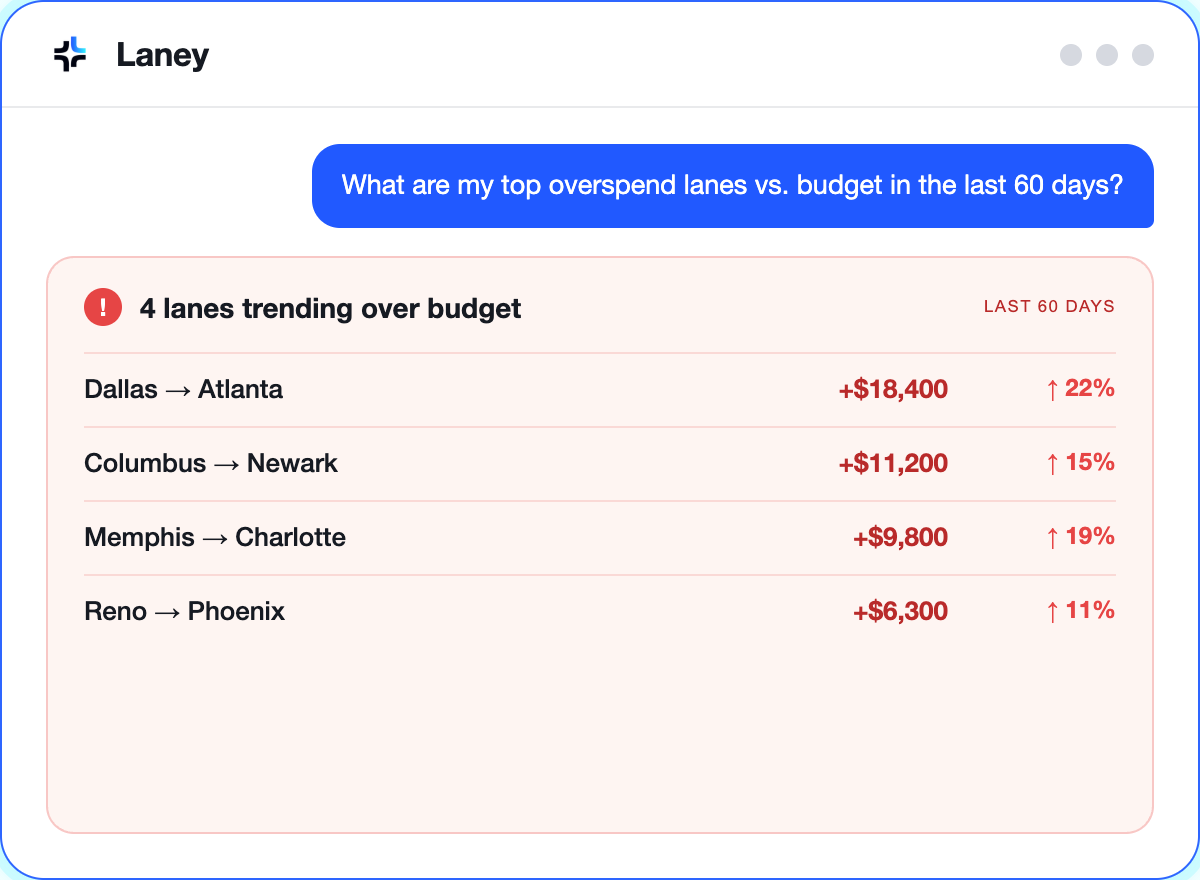
Chat window from Laney showing overspend alert for top budget lanes in the last 60 days: Dallas to Atlanta +$18,400 (up 22%), Columbus to Newark +$11,200 (up 15%), Memphis to Charlotte +$9,800 (up 19%), Reno to Phoenix +$6,300 (up 11%).

RFP Diagnostics

Understand why a bid underperformed and what to change before the next round.
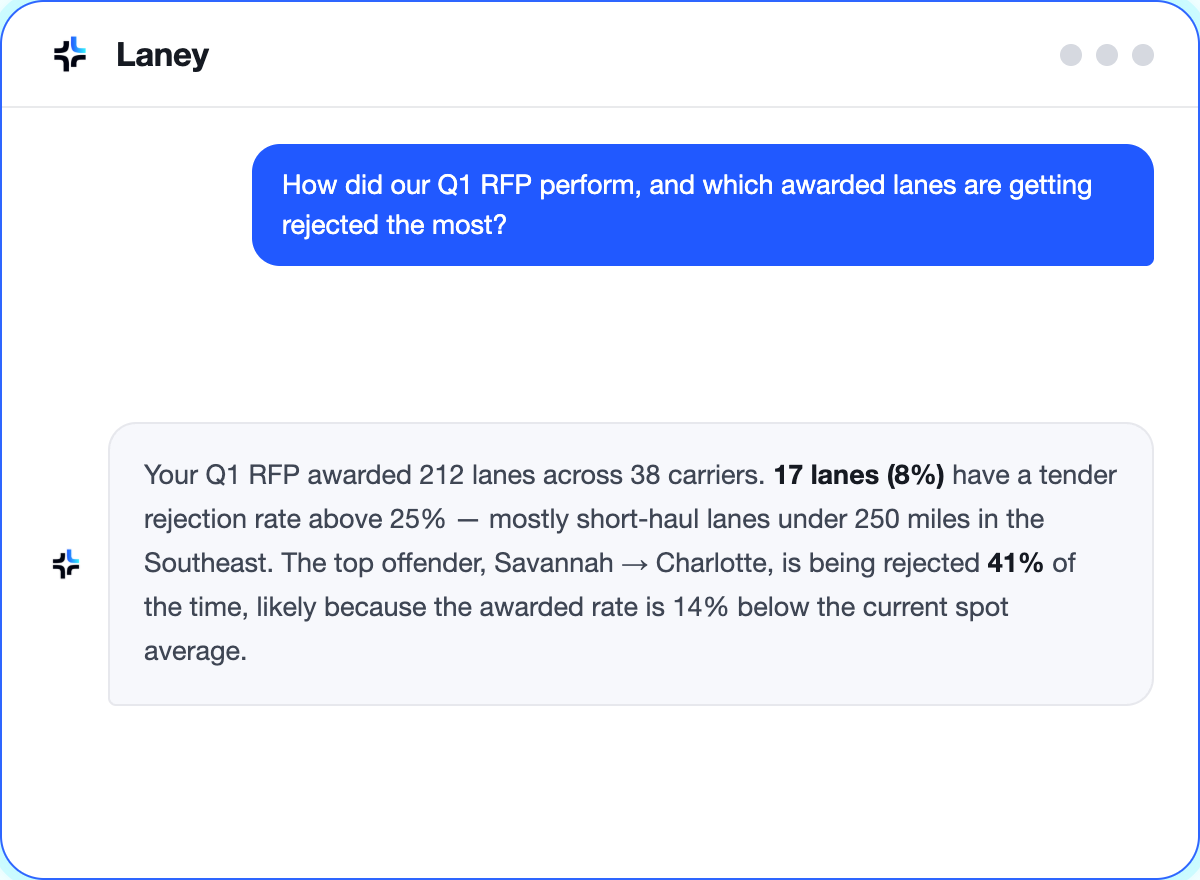
Chat interface with Laney showing a question about Q1 RFP performance and rejection of awarded lanes, followed by Laney's response explaining that 17 lanes with over 25% tender rejection are mostly short-haul under 250 miles in the Southeast, with Savannah to Charlotte lane rejected 41% of the time due to awarded rate being 14% below spot average.

Mode Optimization

Spot opportunities to shift freight to a cheaper mode and estimate the savings.
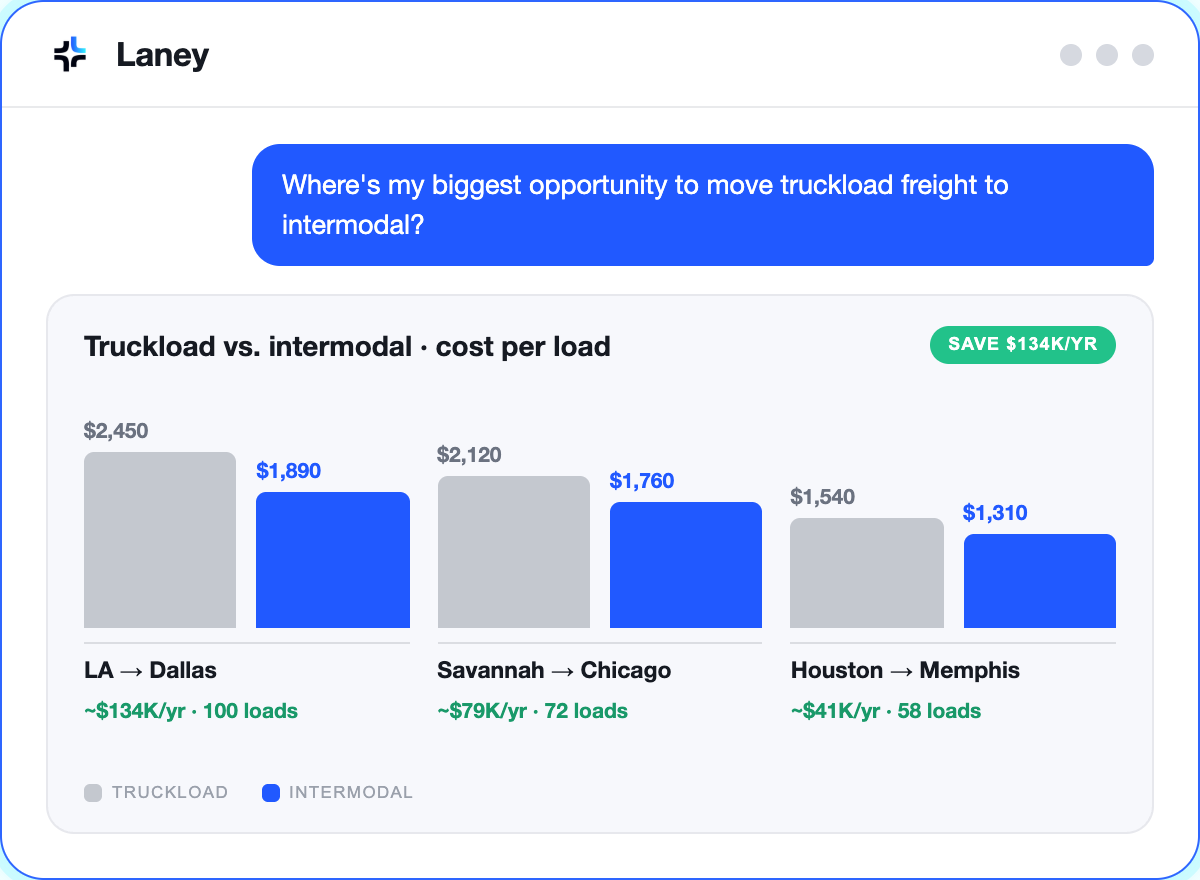
A Laney interface showing a question about the biggest opportunity to move truckload freight to intermodal. A comparison chart of truckload vs. intermodal cost per load displays three routes with truckload costs in gray and intermodal costs in blue: LA to Dallas ($2,450 vs. $1,890), Savannah to Chicago ($2,120 vs. $1,760), and Houston to Memphis ($1,540 vs. $1,310). Annual savings and load counts in green indicate $134K/year savings for 100 loads on LA to Dallas, $79K/year for 72 loads Savannah to Chicago, and $41K/year for 58 loads Houston to Memphis. A label highlights saving $134K/year.
‹
›

Built to deliver business impact

Hear it from the transportation teams running their networks on GoodShip.

20%

Decrease in Late Loads

3-5%

Reduced Spend to Market

4 Weeks

Average Implementation

“GoodShip brings our data, pricing strategy, and operational expertise together in one place, giving our teams the ability to make smarter decisions, strengthen our network, and deliver better outcomes for our customers.”

Robert Low

Robert Low,
Founder & CEO, Prime Inc.

"What really stood out to us about GoodShip is how powerful their data and analytics are, it allows us to really dive into our network and drive efficiencies across the business."

Bryan Rekowski

Bryan Rekowski,
COO & Co-Founder, Hoplite Logistics

"GoodShip understands that the relationship between a shipper and carrier goes beyond rates on paper. Leveraging the platform, we’ve been able to unlock critical insights that were previously opaque."

Nicolle Shuman

Nicole Schuman,
Transportation Procurement Manager,. Reser's Fine Foods

Easy implementation and fast adoption

icon-tech

Built for your existing tech stack

Connect your TMS, ERP, and market intelligence without overhauling your existing technology stack.

icon-time

Minimal IT involvement

Implementation typically requires just 1–2 hours per week from a single IT resource.

icon-ai

AI grounded in your network

Recommendations based on your data, not generic models.

icon-team

Dedicated
team

A powerful platform backed by dedicated Customer Success Managers with deep industry expertise.

See GoodShip in action

Schedule a demo to see how GoodShip can help your team make faster, more informed transportation decisions.

Request a Demo