
Freight Lane Analysis That Actually Drives Better Decisions

Most transportation teams already have lane data. They can see rates, volumes, and carriers. They can pull reports. They can export spreadsheets. But that does not mean they have real lane visibility. Because knowing your rate per mile is not the same as understanding whether a lane is competitive, whether carriers actually want it, or whether it is likely to perform well over time. That is where freight lane analysis tends to fall short.
Why Lane Data Alone Is Not Enough
A single number rarely tells the full story.
Looking at a lane like AL → AZ in isolation might show:
- a historical rate
- a benchmark comparison
But it does not explain:
- whether capacity is tight or loose
- whether carriers see backhaul opportunity
- how that lane performs operationally
In practice, teams are left stitching together multiple data points just to answer basic questions.
That slows down decision-making and creates blind spots.
What Freight Lane Analysis Should Look Like
The goal of lane analysis is not reporting. It is clarity.
A useful view of a lane should combine multiple dimensions at once:
- cost compared to market benchmarks
- carrier behavior across acceptance and performance
- network dynamics like capacity and backhaul
- historical trends such as seasonality and lead time
That is what allows teams to move from observation to action.
Instead of asking “what is the rate,” teams can ask:
- Is this lane priced correctly?
- Is it attractive to carriers?
- Where are we exposed?
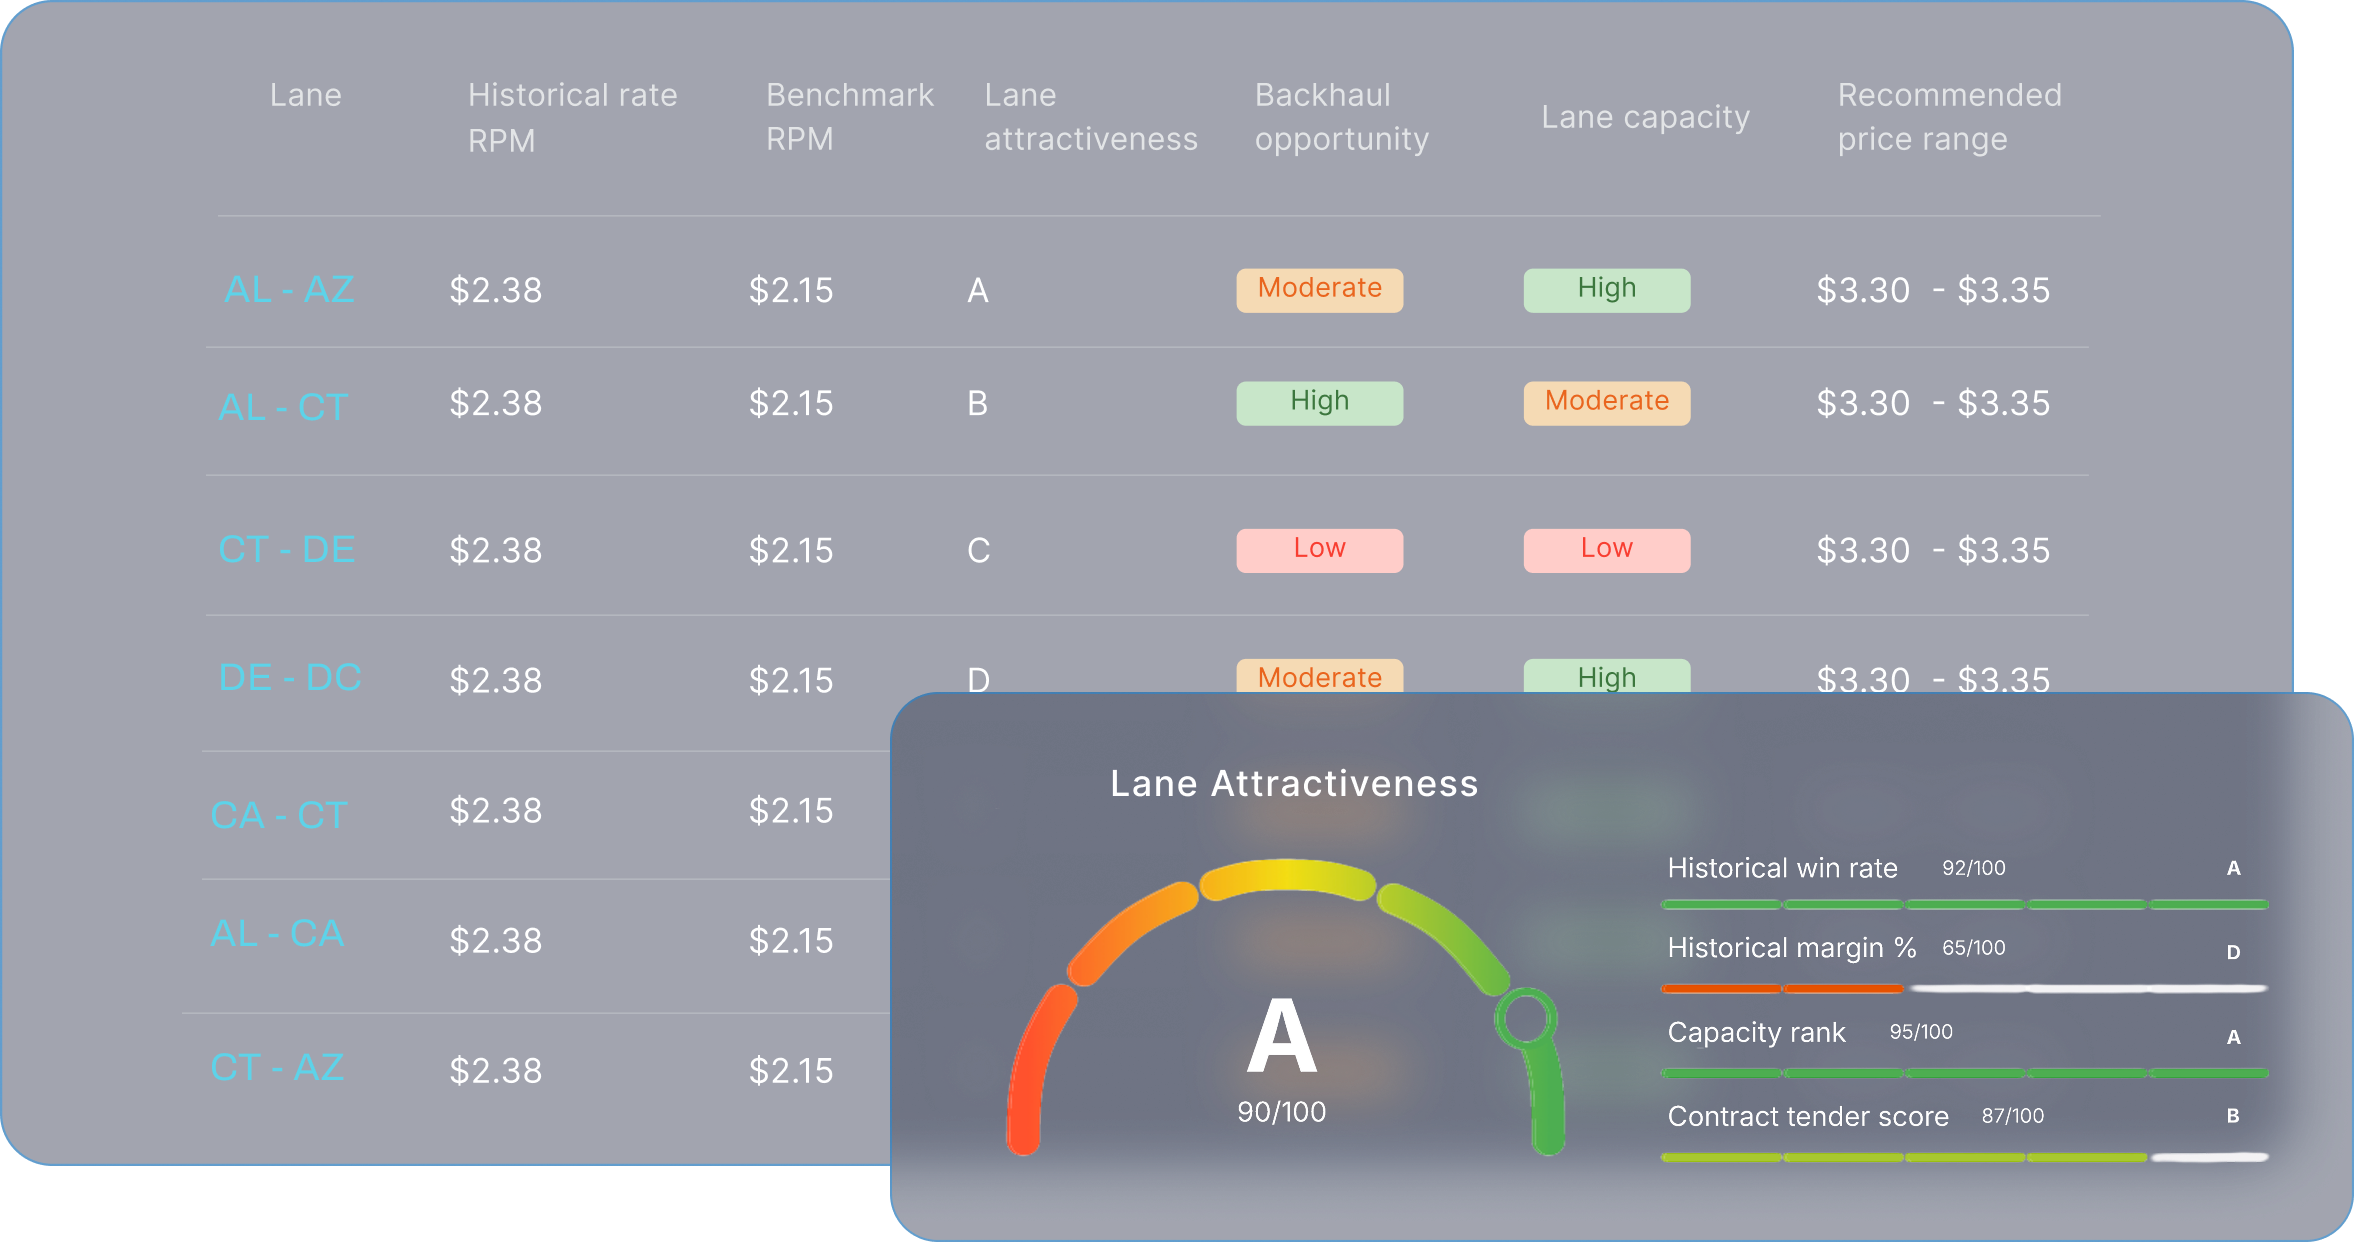
What the Data in This View Actually Tells You
Looking at a structured lane analysis view like the one above, each column adds context.
- Historical rate vs benchmark shows whether you are above or below market
- Lane attractiveness reflects how carriers view the lane based on multiple factors
- Backhaul opportunity indicates whether carriers can easily find return freight
- Capacity highlights how competitive the lane is in the market
- Recommended price range gives a grounded target for procurement
Individually, these are useful. Together, they become actionable.
For example, a lane with:
- above-market pricing
- low backhaul opportunity
- limited capacity
is fundamentally different from one with strong carrier demand and balanced economics.
That distinction is what drives better procurement and carrier decisions.
How GoodShip Turns Lane Data Into Decisions
GoodShip’s Analytics and Recommendations platform is designed to bring all of these dimensions together in one place.
Instead of working across disconnected reports, teams get:
- lane-level spend visibility
- real-time benchmarking against market data
- carrier performance tracking tied to specific lanes
This creates a clearer picture of how each lane behaves.
More importantly, it surfaces where action is needed.
GoodShip automatically highlights:
- lanes running above market benchmarks
- lanes with service issues
- lanes that rely heavily on the spot market
Each of these signals points to a specific opportunity, whether that is renegotiation, reallocation, or a new procurement event.
From Analysis to Recommendation
One of the biggest gaps in freight analytics is the step between insight and action.
Teams can identify issues, but acting on them still requires additional work.
GoodShip closes that gap by connecting analytics directly to execution.
Every insight is tied to a next step:
- carrier performance alerts
- pricing adjustments
- procurement actions
This allows teams to move from identifying a problem to addressing it quickly.
Where Laney Changes the Workflow
On top of these analytics, Laney adds a different way to interact with lane data.
Instead of building reports or filtering dashboards, teams can ask direct questions like:
- Which lanes are above market this quarter?
- Where are we most exposed to spot?
- What happens if we shift carriers on this lane?
Laney analyzes the network in real time and returns answers based on actual transportation data, including loads, carriers, contracts, and benchmarks .
It can also:
- model procurement scenarios
- analyze carrier performance trends
- generate reports on demand
This removes the lag between question and answer.
Instead of waiting on analysis, teams can move directly into decision-making.
Why Lane-Level Context Matters for Procurement
Freight procurement decisions are only as strong as the underlying lane data.
If a lane looks competitive on price but:
- has weak carrier performance
- lacks backhaul opportunity
- shows unstable capacity
the outcome will not match expectations.
With proper lane analysis, teams can:
- set more realistic pricing targets
- select carriers based on fit, not just cost
- reduce variability in execution
That leads to more stable networks and fewer surprises after awards.
What This Changes for Transportation Teams
When lane analysis is structured and actionable, teams work differently.
They spend less time:
- building reports
- reconciling data across systems
- debating assumptions
And more time:
- evaluating tradeoffs
- improving carrier relationships
- optimizing the network continuously
The shift is not just faster analysis. It is better decisions.
The Bottom Line
Freight lane analysis is not about having more data.
It is about having the right context around that data.
When cost, performance, capacity, and market dynamics are all visible in one place, decisions become clearer.
With platforms like GoodShip, lane analysis becomes part of everyday operations—not just something reviewed during procurement cycles.


